How To Measure IOPS Of A Virtual Machine With Resource Metering And MeasureVM

The first time we used the Storage QoS capabilities in Windows Server 2012 R2 it was done in a trial and error fashion. We knew that it was the new VM causing the disruption and kind of dropped the Maximum IOPS to a level that was acceptable.  We also ran some PerfMon stats & looked at the IOPS on the HBA going the host. It was all a bit tedious and convoluted.  Discussing this with Senthil Rajaram, who’s heavily involved with anything storage at Microsoft he educated me on how to get it done fast & easy.

Fast & easy insight into virtual machine IOPS.

The fast and easy way to get a quick feel for what IOPS a VM is generating has become available via resource metering and Measure-VM. In Windows Server 2012 R2 we have new storage metrics we can use for that, it’s not just cool for charge back or show back Smile.

So what did we get extra  in Windows Server 2012 R2? Well, some new storage metrics per virtual disk

  1. Average Normalized IOPS (Averaged over 20s)
  2. Average latency (Averaged over 20s)
  3. Aggregate Data Written (between start and stop metric command)
  4. Aggregate Data Read (between start and stop metric command)

Well that sounds exactly like what we need!

How to use this when you want to do storage QoS on a virtual machine’s virtual disk or disks

All we need to do is turn on resource metering for the VMs of interest. The below command run in an elevated PowerShell console will enable it for all VMs on a host.image

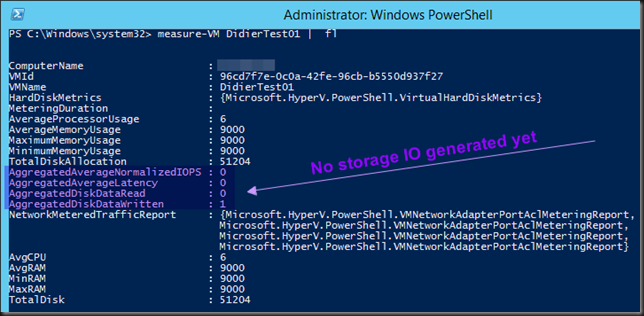
We now run measure-VM DidierTest01 | fl and see that we have no values yet for the properties . Since we haven’t generated any IOPS yes this is normal.image

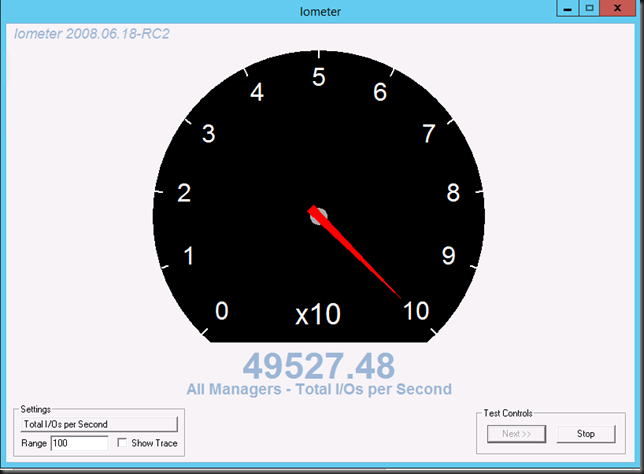
So we now run IOMeter to generate some IOPSimage

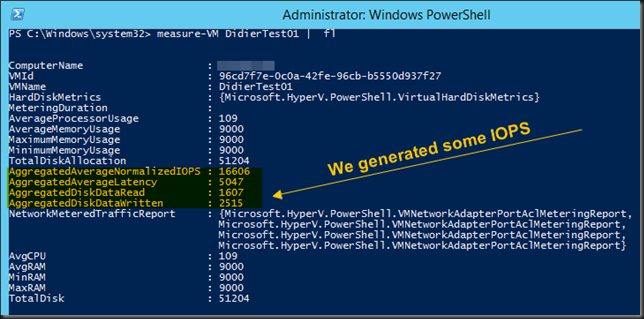
and than run measure-VM DidierTest01 | fl again. We see that the properties have risen.image

It’s normal that the AggregatedAverageNormalizedIOPS and AggregatedAverageLatency are the averages measured over a period of 20 seconds at the moment of sampling. The value  AggregatedDiskDataRead and AggregatedDiskDataWritten are the averages since we started counting (since we ran Enable-VMResourceMetering for that VM ), it’s a running sum, so it’s normal that the average is lower initially than we expected as the VM was idle between enabling resource metering and generating some IOPS.

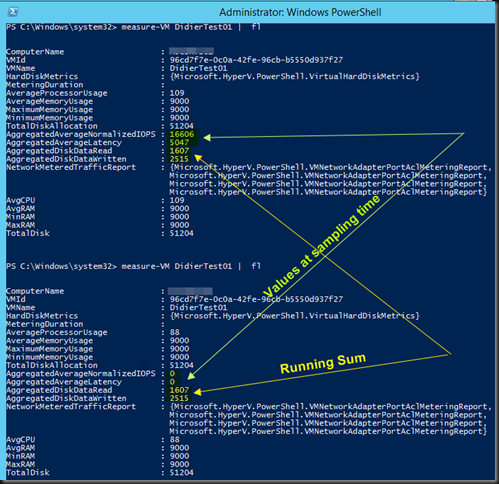
All we need to do is keep the VM idle wait 30 seconds so and when we run again measure-VM DidierTest01 | fl again we see the following?image

While the values AggregatedAverageNormalizedIOPS and AggregatedAverageLatency are the value reflecting a 20s average that’s collected at measuring time and as such drop to zero over time. The values for AggregatedDiskDataRead and AggregatedDiskDataWritten are a running sum. They stay the same until we disable or reset resource metering.

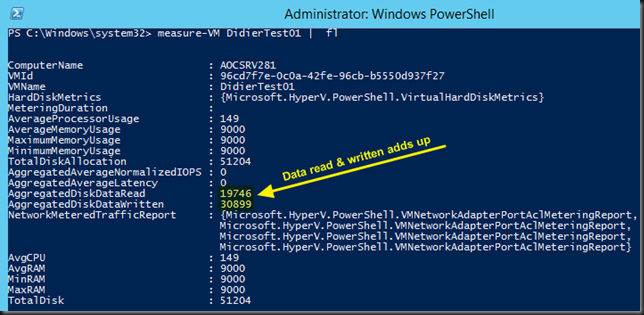
Let’s generate some extra IO, after which we wait a while (> 20 seconds) before we run measure-VM DidierTest01 | fl again and get updated information. We confirm see that indeed AggregatedDiskDataRead and AggregatedDiskDataWritten is a running sum and that AggregatedAverageNormalizedIOPS and AggregatedAverageLatency have dropped to 0 again.

image

Anyway, it’s clear to you that the sampled value of AggregatedAverageNormalizedIOPS is what you’re interested in when trying to get a feel for the value you need to set in order to limit a virtual hard disk to an acceptable number of normalized IOPS.

But wait, that’s aggregated! I have SQL Server VMs with 4 virtual hard disks. How do I know what hard disk is generating what IOPS? The docs say the metrics are per virtual hard disk, right?! I need to know if it’s the virtual hard disk with TempDB or the one with the LOGS causing the IO issue.

Well the info is there but it requires a few more lines of PowerShell:

cls
$VMName  = "Didiertest01" 
enable-VMresourcemetering -VMName $VMName 
$VMReport = measure-VM $VMName 
$DiskInfo = $VMReport.HardDiskMetrics
write-Host "IOPS info VM $VMName" -ForegroundColor Green
$count = 1
foreach ($Disk in $DiskInfo)
{
Write-Host "Virtual hard disk $count information" -ForegroundColor cyan
$Disk.VirtualHardDisk | fl  *
Write-Host "Normalized IOPS for this virtual hard disk" -ForegroundColor cyan
$Disk
$count = $Count +1 
}

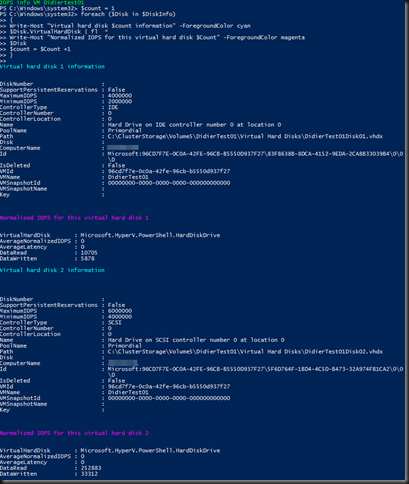
Resulting in following output:

image

Hope this helps! Windows Server 2012 R2 make life as a virtualization admin easier with nice tools like this at our disposal.

Windows Server 2012 R2 Cluster Reset Recent Events With PowerShell

I blogged before about the fact that since Windows Server 2012  we have the ability to reset the recent events shown so that the state of the cluster is squeaky clean with not warnings or errors. You can read up on this here. Windows Server 2012 Cluster Reset Recent Events Feature.

You can also do this in PowerShell like in the example below:

#Connect to cluster & get current RecentEventsResetTime value
$MyCluster = Get-CLuster -name "W2K12R2RTM"
$MyCluster.RecentEventsResetTime

#Reset recent events
$MyCluster.RecentEventsResetTime = get-date
$MyCluster.RecentEventsResetTime

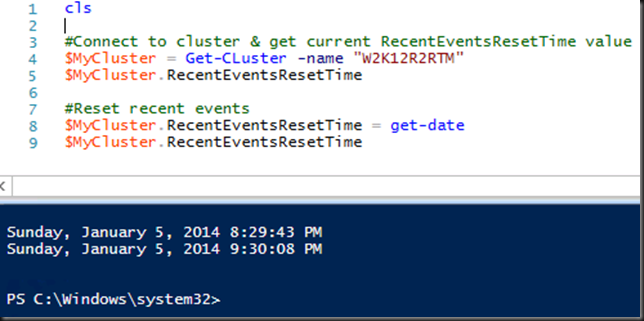
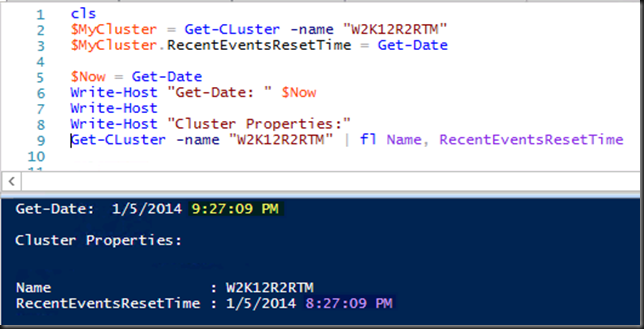
As you may notice, the RecentEventsResetTime is displayed in UTC when read form the cluster after connecting to it. Right after you set it it displays the time respectful of the time zone you’re in right until you connect to the cluster again. We demonstrate this in the 2 screenshots below (I’m at GMT+1).

image

image

This comes in handy when writing test, comparison & demo scripts. Often you do things with the network that causes network connectivity to be lost when the NIC gets reset (disabled/enabled) and such. Also when something fails as part of the demo or tests scripts it’s nice to start the rerun or the next part of the demo/test with a clean cluster GUI when you’re showcasing stuff. Unfortunately an already GUI doesn’t refresh these setting if the reset is not done in the GUI. So you need to open a new one. For scripting you don’t have this issue. EDIT: In Windows 2012 R2 you can use the $MyCluster.Update() to reflect the new value of RecentEventsResetTime in UTC without having to reconnect to the cluster. In Windows Server 2012 this Update method isn’t available but it seems to happen automatic.

PowerShell: Monitoring DrainStatus of a Hyper-V Host & The Time Limited Value of Information In Beta & RC Era Blogs

I was writing some small PowerShell scripts to kick pause and resume Hyper-V cluster hosts and I wanted to monitor the progress of draining the virtual machines of the node when pausing it. I found this nice blog about Draining Nodes for Planned Maintenance with Windows Server 2012 discussing this subject and providing us with the properties to do just that.

It seems we have two common properties at our disposal: NodeDrainStatus and NodeDrainTarget.

image

So I set to work but I just didn’t manage to get those properties to be read. It was like they didn’t exist. So I pinged Jeff Wouters who happens to use PowerShell for just about anything and asked him if it was me being stupid and missing the obvious. Well it turned out to be missing the obvious for sure as those properties do no exist. Jeff told me to double check using:

Get-ClusterNode MyNode -cluster MyCluster | Select-Object -Property *

Guess what, it’s not NodeDrainStatus and NodeDrainTarget but DrainStatus and DrainTarget.

image

What put me off here was the following example in the same blog post:

Get-ClusterResourceType "Virtual Machine" | Get-ClusterParameter NodeDrainMoveTypeThreshold

That should have been a dead give away. As we’ve been using MoveTypeTresHold a lot the recent months and there is no NodeDrain in that value either. But it just didn’t register. By the way you don’t need to create the property either is exists. I guess this code was valid with some version (Beta?) but not anymore. You can just get en set the property like this

Get-ClusterResourceType “Virtual Machine” -Cluster MyCluster | Get-ClusterParameter MoveTypeThreshold

Get-ClusterResourceType “Virtual Machine” -Cluster MyCluster | Set-ClusterParameter MoveTypeThreshold 2000

So lessons learned. Trust but verify Smile.  Don’t forget that a lot of things in IT have a time limited value. Make sure that to look at the date of what you’re reading and about what pre RTM version of the product the information is relevant to.

To conclude here’s the PowerShell snippet I used to monitor the draining process.


Suspend-clusternode –Name crusader -Cluster warrior -Drain

Do
{
    Write-Host (get-clusternode –Name “crusader” -Cluster warrior).DrainStatus -ForegroundColor Magenta    
    Sleep 1
}
until ((get-clusternode –Name “crusader” -Cluster warrior).DrainStatus -ne "InProgress")

If ((get-clusternode –Name “crusader” -Cluster warrior).DrainStatus -eq "Completed")
{
    Write-Host (get-clusternode –Name “crusader” -Cluster warrior).DrainStatus -ForegroundColor Green
}

Which outputs

image

Understanding Virtual Machine Priority and Preemption Behavior

Introduction

By reading Aidan Finn his blog You Pause A Clustered Hyper-V Host And Low Priority VMs are QUICK MIGRATED! you will learn something about how virtual machine priorities work during the pausing and draining of a clustered Hyper-V host. They are either Live or quick migrated depending on the value of the MoveTypeThreshold cluster parameter for resources of the type “Virtual Machine”. By default it’s at 2000 and that happens to be the value of the virtual machine priority “Low”.

Changing this value can alter the default behavior. For example setting the MoveTypeThreshold value to 1000 using PowerShell

Get-ClusterResourceType “Virtual Machine” | Set-ClusterParameter MoveTypeThreshold 1000

makes sure that only VMs with a priority set to “No Auto Restart”  are quick migrated. The  low priority machines would than also live migrate where by default they quick migrate.

  • Virtual Machines with Priority equal to or higher than the value specified in MoveTypeThreshold will be moved using Live Migration.
  • Virtual Machines with Priority lower than the value specified in MoveTypeThreshold will be moved using Quick Migration.

Virtual Machine Priorities
3000 = High
2000 = Medium
1000 = Low
0 = Virtual machine does not restart automatically.

Another Scenario to be aware of  to avoid surprises

Note that al this also comes into play in other scenario’s. One of them is when you attempt to start a guest that requires more resources than available on the host. Preemption kicks in and the lower priority virtual machines go into a saved state.  If you didn’t plan for this it could be a bit of a surprise, causing service interruption. What’s also important to know is that preemption kicks in even when there is no chance that putting lower priority virtual machines into saved mode will free enough resources for (all) the VMs you’re trying to start. So that service interruption might do you no good. If this is the case the Low priority VMS come back up when there are sufficient resources left.  Do note however that the ones set top “No Auto Restart” remain in a saved state. Look below for an example on how this could happen.

How does this happen?

Let’s say you have a brand new VM that has gotten 16GB of RAM as requested by the business. When that large memory guest starts it will fail due to the fact that there are not enough memory resources available on the host that only has 16GB available. But as it attempts to start, the need for memory resources is detected and preemption comes into play. The guests with “Low” and “No Auto Restart” priorities are put into a saved state as the large memory VM has the default medium priority and the MoveTypeTreshold is at the default of 2000. You need to be ware of this behavior. Preemption kicks in and the machines are still saving while starting the large memory VM has already failed as they couldn’t free enough resources anyway.

image

The good new is that, as you can see below, is that the low priority guest starts again after starting the large memory guest has failed. No use keeping it saved as it can run and service customers. So the service interruption for this VM is limited but it does happen. Please also note that the guest set to No Auto Restart doesn’t come up again as it’s priority status says exactly that. So, this one becomes collateral damage.

image

As you can see it’s important to know how priorities and preemption work together and behave. It also good to know that changing the threshold come into play in more situations that just pausing & draining a host of during a fail over. While the cluster will try it’s best to keep as many VMs up and running you might have some unintended consequences under certain conditions. A good understanding of this can prevent you from being bitten here. So build a small cheap lab so you can play with stuff. This helps to gain a better understanding of how features work and behave. If you want to play some more, set the priority of the memory hungry VM to high you’ll see even more interesting things happen.