No matter what high quality gear you use, how well you design your environment and how much redundancy you build in you will see transient failures in your environment at one point in time. In combination with the push to ever more commodity hardware and the increased use of converged deployments leveraging Ethernet transient failures have become more frequent occurrence then they used to be.
Failover clustering by tradition reacts very “assertive” to failures in order to provide high to continuous availability to our virtual machines. That’s great, we want it to do that, but this binary approach comes at a cost under certain conditions. When reacting too fast and too proactively to transient failures we actually can get less high or continuous availability in certain scenarios than if the cluster would just have evaluated the situation a bit more cautiously. It’s for this reason that Microsoft introduced increased “Virtual Machine Compute Resiliency” to deal with intra-cluster communication failures in a Windows Server 2016 cluster.
I have helped out a number of fellow MVPs over the past 6 months with this new feature and I dove back into my lab notes to blog about this and help you out with your own testing. The early work was done with Technical Preview v1. In that release it was disabled by default (the value for cluster property “ResiliencyDefaultPeriod” was set to 0) and the keyword “Default” was used in cluster property “resiliencylevel” for the what is now called ‘IsolateOnSpecialHeartbeat’ and is no longer the default at installation. If that doesn’t confuse you yet, I’ll find another reason to tell you to move to technical preview v2. In TPv2 Virtual Machine Compute Resiliency is enabled and configured by default but in TPv1 you had to enable and configure it yourself. I advise you to stop testing with v1 and move to v2 and future technical preview release in order for you to test with the most recent bits and functionality.
Investigating the feature configuration
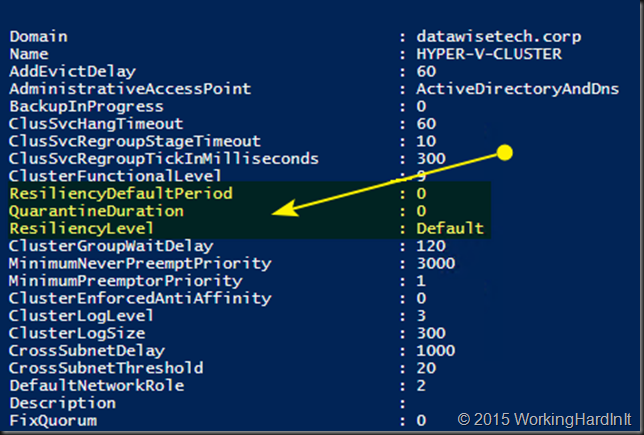
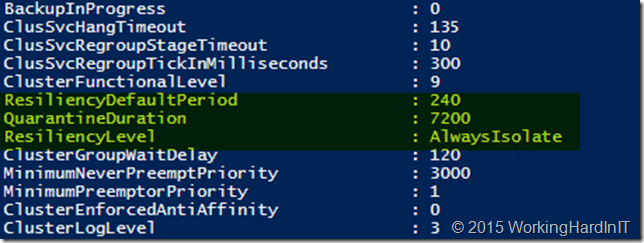
When testing new features in Windows Server Technical Preview Hyper-V you’re on your own once in a while as much is not documented yet. Playing around with PowerShell helps you discover stuff. A Get-Cluster | fl * teaches us all kinds of cool stuff such as these new cluster properties:
ResiliencyDefaultPeriod
QuarantineDuration
ResiliencyLevel
Here’s a screenshot of Windows Server 2016TPv1 (Please stop using this version and move to TPv2!)

Now when you’re running Windows Server 2016TP v2 this feature has been enabled by default (ResilienceyDefaultPeriod has been filled out as well as QuarantineDuration) and the resiliency level has been set to “AlwaysIsolate”.

After some lab work with this I figured out what we need to know to make VM Compute Resiliency to work in our labs:
- Make sure your cluster functional level is running at version 9
- Make sure your VMs are at version 6.X
- Make sure the Operating systems of the VM is Windows Server Technical Preview v2 (Again move away from TPv1)
- Enable Isolation/Quarantine via PowerShell:
(get-cluster).resiliencylevel
(get-cluster).resiliencylevel = ‘AlwaysIsolate’ or 2
(get-cluster).resiliencylevel
(get-cluster).resiliencylevel = ‘IsolateOnSpecialHeartbeat’ or 1
(get-cluster).resiliencylevel
Please note that all nodes need to be on line to make this change in the technical preview. I got the two accepted values by trial and error and the blog by Subhasish Bhattacharya confirms these are the only 2 ones.
- Set the timings to some not too high and not too low value to play in the lab without having to wait to long before it’s back to normal (the values I use in my current Technical Preview lab environment are not a recommendation whatsoever, they only facilitate my testing and learning, this has nothing to do with any production environment) . For lab testing I chose:
(get-cluster).ResiliencyDefaultPeriod = 60 Note that setting this to 0 reverts you back to pre Windows Server 2016 behavior and actually disables this feature. The default is 240 seconds
(get-cluster).QuarantineDuration = 300 The default is 7200 seconds, but I’m way to impatient in my lab for that so I set the quarantine duration lower as I want to see the results of my experiments fast, but beware of just messing with this duration in production without thinking about it. Just saying!
Testing the feature and its behaviour
Then you’re ready to start abusing your cluster to demo Isolation mode & quarantine. I basically crash the Cluster service on one of the nodes in the cluster. Note that cleanly stopping the service is not good enough, it will nicely drain that node for you. which is not what we want to see. Crash it of force stop it via stop-process -name clussvc –Force.
So what do we see happen:
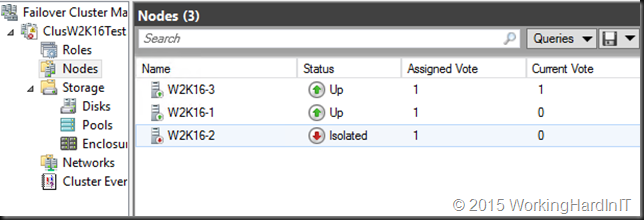
- The node on which we crashed the cluster server experiences a “transient” intra-cluster communication failure. This node is placed into an Isolated state and removed from its active cluster membership.

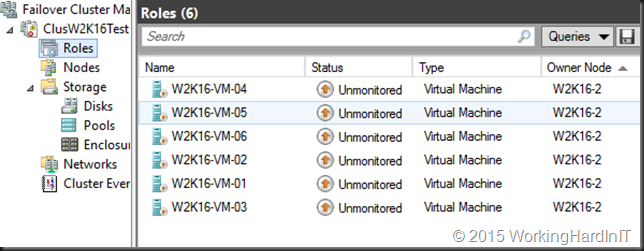
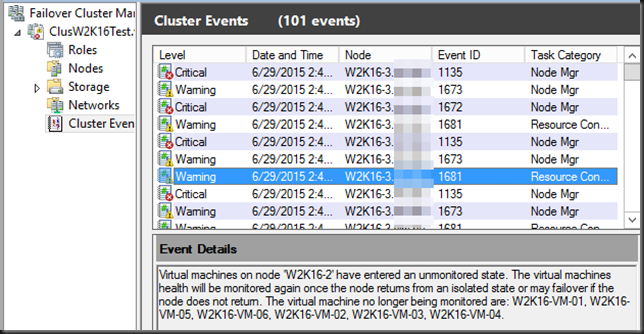
- The VMs running at version 6.2 go into Unmonitored state. The other ones just fail over. Unmonitored means you that the cluster is no longer actively managing the VM but you can still look at the condition of the VM via PowerShell or Hyper-V manager.


Based on the type of storage you’re using for your VMs the story is different:
- File Storage backed (SMB3/SOFS): The VM continues to run in the Online state. This is possible because the SMB share itself has no dependency on the Hyper-V cluster. Pretty cool!
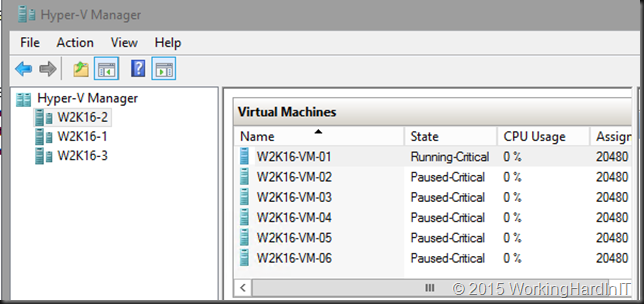
- Block Storage backed (FC / FCoE / iSCSI / Shared SAS / PCI RAID)): The VMs go to Running-Critical and then placed in the Paused Critical state. As you have a intra-cluster communication failure (in our case losing the cluster service) the isolated node no longer has access to the Cluster Shared Volumes in the cluster and this is the only option there is.

- If the isolated node doesn’t recover from this presumed transient failure it will, after the time specified in ResiliencyDefaultPeriod (default of 4 minutes : 240 s) go into a down state. The VMs fail over to another node in the cluster. Normally during this experiment the cluster service will come back on line automatically.
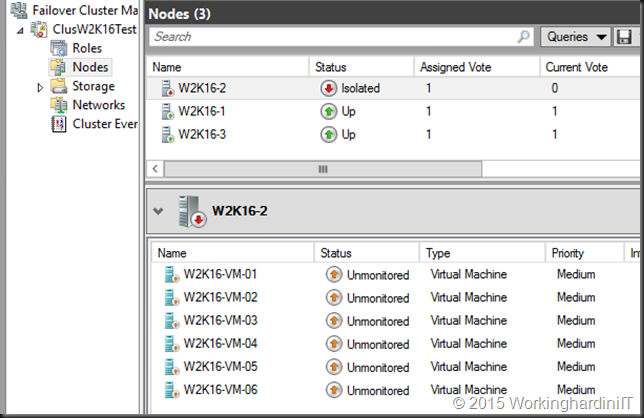
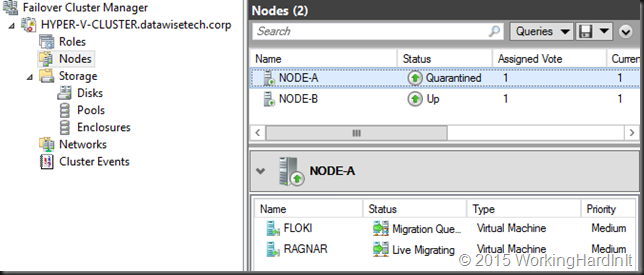
- If a node, does recover but goes into isolated 3 times within 1 hour, it is placed into a Quarantine state for the time specified in QuarantineDuration (default two hours or 7200 s) . The VMS running on this node are drained to another node in the cluster. So if you crash that service repeatedly (3 times within an hour) the Hyper-V Node will go into “Quarantine” status for the time specified (in our lab 5 minutes as we set it to 300 s). The VMs will be live migrated off even if the node is up and running when the cluster service comes up again.
You might notice that this screenshot is a different lab cluster. Yes, it’s a TPv1 cluster as for some reason the Live Migration part on Quarantine is broken on my TPv2 lab. It’s a clean install, completely green field. Probably a bug.
It’s the frequency of failures that determines that the node goes into quarantine for the amount of time specified. That’s a clear sign for you to investigate and make sure things are OK. The node is no longer allowed to join the cluster for a fixed time period (default: 2 hours). The reason for this is to prevent “flapping nodes” from negatively impacting other nodes and the overall cluster health. There is also a fixed (not configurable as far as I know) amount if nodes that can be quarantined at any give time: 20% or only one node can be quarantined (whatever comes first, in the case of a 2, 3 or for node cluster it’s one node max that can be in quarantine).
If you want to get a quarantined node out of quarantine immediately you can rejoin it to the cluster via a single PowerShell command: Start-ClusterNode –CQ (CQ = Clear Quarantine). Handy in the lab or in real live when things have been fixed and you want that node back in action asap.
Conclusion
Now this sounds pretty good doesn’t it? And it is. Especially if you’re running you’re running your VMs on a SOFS share. Then the VMs will remain online during the Isolation / Unmonitored phase but when you have “traditional” block level storage they won’t. They’ll go in mode as the in that design you have lost access to the CSV. Now, if you ever needed yet another reason to move to a Scale Out File Server & SMB 3 to deliver storage for your VMs I have just given you one! Hey storage vendors … how is that full SMB 3 feature stack coming on your storage arrays? Or do you really just want us to abstract you away behind a Windows SOFS cluster?
Subhasish Bhattacharya Has blogged about this as well here. It’s a feature we’ll test at length to get a grip on the behavior so we know how the cluster nodes will behave under certain conditions. Trust, but verify is my mantra and it’s way better to figure out how a feature behaves in the lab than having to figure it out when you see it for the very first time in production based on assumptions. Just saying.
