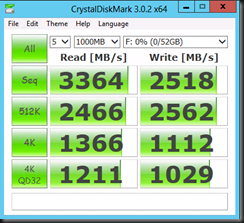
So you have spend some money on RDMA cards (RoCE in this example), spent even more money on 10Gbps Switches with DCB capabilities and last but not least you have struggled for many hours to get PFC, ETS, … configured. So now you’d like to see that your hard work has paid of, you want to see that RDMA power that SMB 3.0 leverages in action. How?
You could just copy files and look at the speed but when you have sufficient bandwidth and the limiting factor is in disk IO for example how would you know? Well let’s have a look below.
You can take a look at performance monitor for RDMA specific counters like “RDMA Activity” and “SMB Direct Connection”.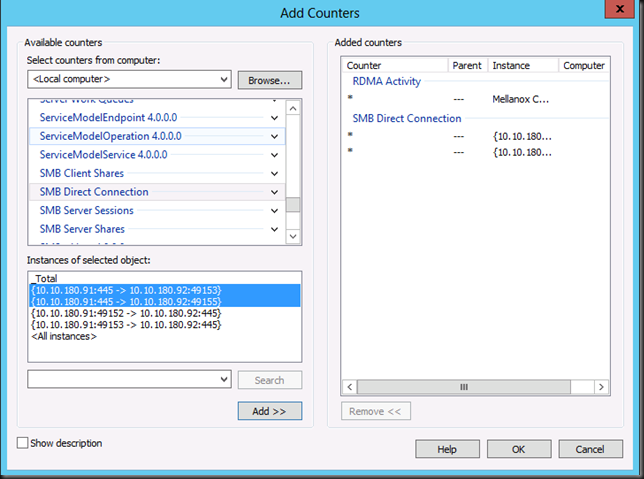
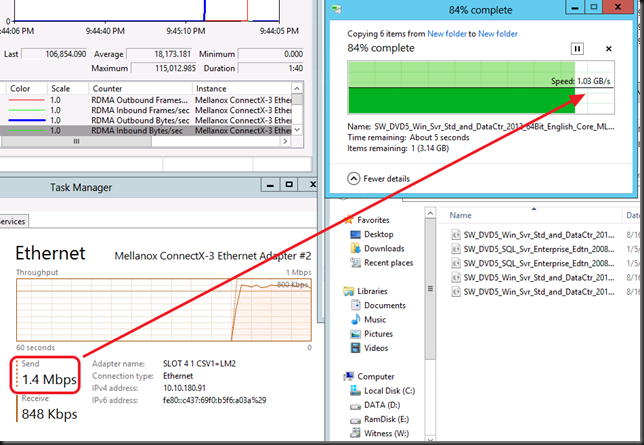
Whilst copying six 3.4GB ISO files over the RDMA connection we see a speed of 1.05 GB/s. Not to shabby. But hay nothing a good 10Gbps with TCP/IP can handle under the right conditions.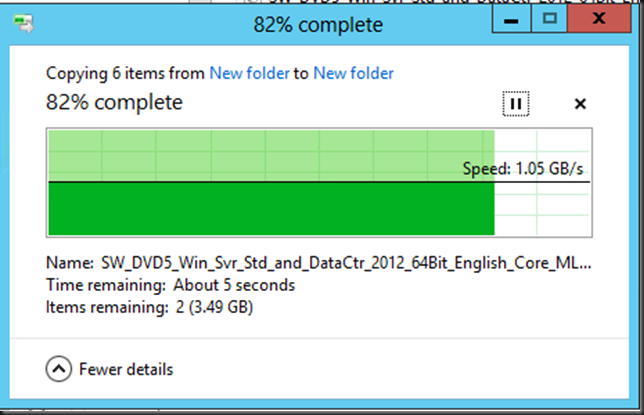
It’s the RDMA counters in Performance Monitor that show us the traffic that going via SMB Direct.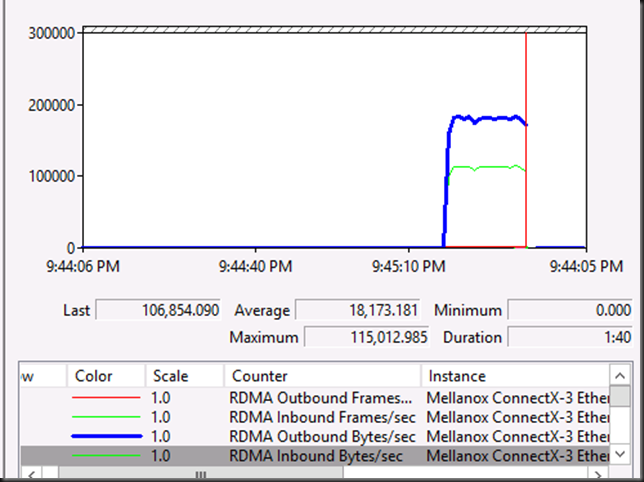
Another give away that RDMA is in play comes from Task Manager, Performance counters for the RDMA NIC => 1.3Mbps send traffic can’t possibly give us 1.05GB/s in copy speed magically ![]()
When you run netstat –xan (instead of the usual –an) you get to see the RDMA connection. The mode is “Kernel” instead of the usual “TCP” or “UDP” with –an showing the TCP/IP connections/Listerners.
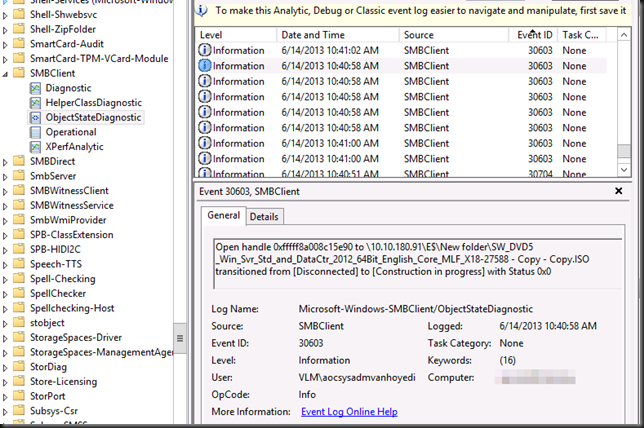
If you want to go all geeky there is an event log where you look at RDMA events amongst others. Jose Baretto discusses this in Deploying Windows Server 2012 with SMB Direct (SMB over RDMA) and the Mellanox ConnectX-3 using 10GbE/40GbE RoCE – Step by Step with instructions how to use it. You’ll need to go to Event Viewer.On the menu, select “View” then “Show Analytic and Debug Logs”
Expand the tree on the left: Applications and Services Log, Microsoft, Windows, SMB Client, ObjectStateDiagnostic. On the “Actions” pane on the right, select “Enable Log”
You then run your RDMA work. And then disable the log to view the events. Some filtering & PowerShell might come in handy to comb through them.