How To Monitor Storage QoS Minimum IOPS & Identify VM & The Virtual Hard Disk In Windows Server 2012 R2 Hyper-V

At TechEd 2013 John Matthew & Liang Yang presented following session  MDC-B345: Windows Server 2012 Hyper-V Storage Performance. That was a great one. During this they demonstrated the use of WMI to monitor storage alerts related to Storage QoS in Windows Server 2012 R2. We’re going to go further, dive in a bit deeper and show you how to identify the virtual hard disk and the virtual machine.

One important thing in all this is that we need to have the reserve or minimum IOPS not being met, so we run IOMeter to make sure that’s the case. That way the events we need will be generated. It’s a bit of a tedious exercise.

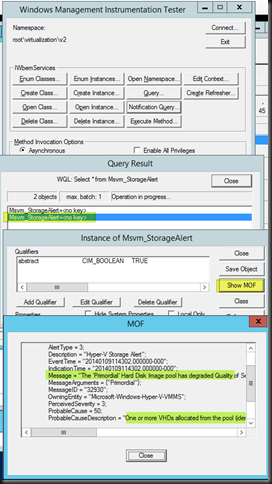
So we start with a wmi notification query, this demonstrates that notifications are sent when the minimum IOPS cannot be met. The query is simply:

select * from Msvm_StorageAlert

image

instance of Msvm_StorageAlert
{
    AlertingManagedElement = "\\TESTHOST01\root\virtualization\v2:Msvm_ResourcePool.InstanceID="Microsoft:70BB60D2-A9D3-46AA-B654-3DE53004B4F8"";
    AlertType = 3;
    Description = "Hyper-V Storage Alert";
    EventTime = "20140109114302.000000-000";
    IndicationTime = "20140109114302.000000-000";
    Message = "The ‘Primordial’ Hard Disk Image pool has degraded Quality of Service. One or more Virtual Hard Disks allocated from the pool is not reporting sufficient throughput as specified by the IOPSReservation property in its Resource Allocation Setting Data.";
    MessageArguments = {"Primordial"};
    MessageID = "32930";
    OwningEntity = "Microsoft-Windows-Hyper-V-VMMS";
    PerceivedSeverity = 3;
    ProbableCause = 50;
    ProbableCauseDescription = "One or more VHDs allocated from the pool (identified by value of AlertingManagedElement property) is experiencing insufficient throughput and is not able to meet its configured IOPSReservation.";
    SystemCreationClassName = "Msvm_ComputerSystem";
    SystemName = "TESTHOST01";
    TIME_CREATED = "130337413826727692";
};

That’s great, but what virtual hard disk of what VM is causing this? That’s the question we’ll dive into in this blog. Let’s go. On MSDN docs on Msvm_StorageAlert class we read:

Remarks

The Hyper-V WMI provider won’t raise events for individual virtual disks to avoid flooding clients with events in case of large scale malfunctions of the underlying storage systems.

When a client receives an Msvm_StorageAlert event, if the value of the ProbableCause property is 50 (“Storage Capacity Problem“), the client can discover which virtual disks are operating outside their QoS policy by using one of these procedures:

Query all the Msvm_LogicalDisk instances that were allocated from the resource pool for which the event was generated. These Msvm_LogicalDisk instances are associated to the resource pool via the Msvm_ElementAllocatedFromPool association.
Filter the result list by selecting instances whose OperationalStatus contains “Insufficient Throughput”.

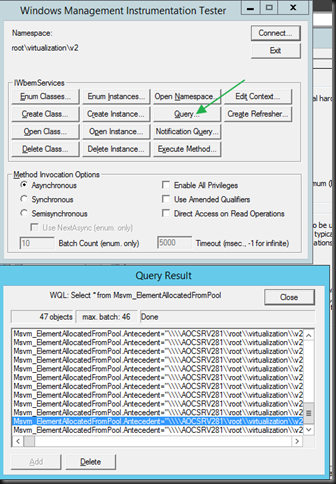
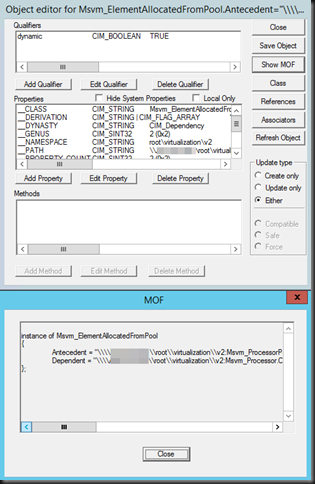
So I query  (NOT a notification query!) the Msvm_ElementAllocatedFromPool class, click through on a result and select Show MOF.

image

image


Let’s look at that MOF …In yellow is the GUID of our VM ID. Hey cool!

instance of Msvm_ElementAllocatedFromPool
{
    Antecedent = "\\TESTHOST01\root\virtualization\v2:Msvm_ProcessorPool.InstanceID="Microsoft:B637F347-6A0E-4DEC-AF52-BD70CB80A21D"";
    Dependent = "\\TESTHOST01\root\virtualization\v2:Msvm_Processor.CreationClassName="Msvm_Processor",DeviceID="Microsoft:b637f346-6a0e-4dec-af52-bd70cb80a21d\\6",SystemCreationClassName="Msvm_ComputerSystem",SystemName="
96CD7F7E-0C0A-42FE-96CB-B5550D937F27"";
};

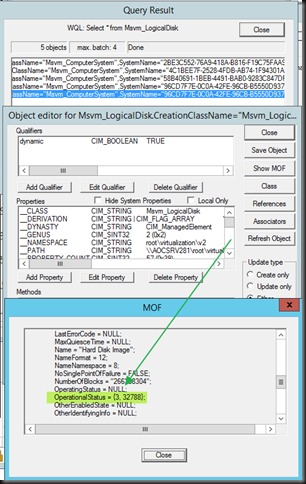
Now we want to find the virtual hard disk in question! So let’s do what the docs says and query Msvn_LogicalDisk based on the VM GUID we find the relates results …

image

Look we got OperationalStatus 32788 which means InsufficientThroughput, cool we’re on the right track … now we need to find what virtual disk of our VM  that is. Well in the above MOF we find the device ID:     DeviceID = "Microsoft:5F6D764F-1BD4-4C5D-B473-32A974FB1CA2\\L"

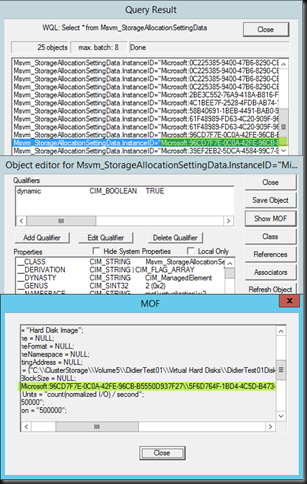
Well if we then do a query for Msvm_StorageAllocationSettingData we find two entrties for our VM GUID (it has two disks) and by looking at the value InstanceID that contains the above DeviceID we find the virtual hard disk info we needed to identify the one not getting the minimum IOPS.

image

HostResource = {"C:\ClusterStorage\Volume5\DidierTest01\Virtual Hard Disks\DidierTest01Disk02.vhdx"};
HostResourceBlockSize = NULL;
InstanceID = "Microsoft:96CD7F7E-0C0A-42FE-96CB-B5550D937F27\5F6D764F-1BD4-4C5D-B473-32A974FB1CA2\\L";

Are you tired yet? Do you realize you need to do this while the disk IOPS is not being met to see the events. This is no way to it in production. Not on a dozen servers, let alone on a couple of hundred to thousands or more hosts is it? All the above did was give us some insight on where and how. But using wbemtest.exe to diver deeper into wmi notifications/events isn’t really handy in real life. Tools will need to be developed to deal with this larger deployments. The can be provided by your storage vendor, your VAR, integrator or by yourself if you’re a large enough shop to make private cloud viable or if you are the cloud provider Smile.

To give you an idea on how this can be done there is some demo code on MSDN over here and I have that compiled for demo purposes.

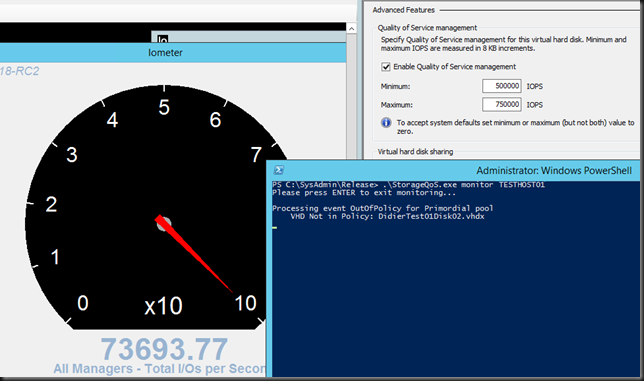
We have 4 VMs running on the host.  One of them is being hammered by IOMeter while it’s minimum IOPS have been set to an number it cannot possibly get. We launch StorageQos to monitor our Hyper-V host.

image

Just let it run and when the notification event that the minimum IOPS cannot be delivered on the storage this monitor will query WMI further to tell us what virtual disk or disks are  involved.  Cool huh! A good naming convention can help identify the VM and this tools works remotely against node so you can launch one for each node of the cluster. Time to fire up Visual Studio 2013 me thinks or go and chat to a good dev you might know to take this somewhere, some prefer this sort of work to the modern day version of CRUD apps any day. If you buy monitoring tools you might want them to have this capability.

While this is just demo code, it gives you an idea of how tools and solutions can be developed & build to monitor the Minimum IOPS part of Storage QoS in Windows Server 2012 R2. Hope you found this useful!

How To Measure IOPS Of A Virtual Machine With Resource Metering And MeasureVM

The first time we used the Storage QoS capabilities in Windows Server 2012 R2 it was done in a trial and error fashion. We knew that it was the new VM causing the disruption and kind of dropped the Maximum IOPS to a level that was acceptable.  We also ran some PerfMon stats & looked at the IOPS on the HBA going the host. It was all a bit tedious and convoluted.  Discussing this with Senthil Rajaram, who’s heavily involved with anything storage at Microsoft he educated me on how to get it done fast & easy.

Fast & easy insight into virtual machine IOPS.

The fast and easy way to get a quick feel for what IOPS a VM is generating has become available via resource metering and Measure-VM. In Windows Server 2012 R2 we have new storage metrics we can use for that, it’s not just cool for charge back or show back Smile.

So what did we get extra  in Windows Server 2012 R2? Well, some new storage metrics per virtual disk

  1. Average Normalized IOPS (Averaged over 20s)
  2. Average latency (Averaged over 20s)
  3. Aggregate Data Written (between start and stop metric command)
  4. Aggregate Data Read (between start and stop metric command)

Well that sounds exactly like what we need!

How to use this when you want to do storage QoS on a virtual machine’s virtual disk or disks

All we need to do is turn on resource metering for the VMs of interest. The below command run in an elevated PowerShell console will enable it for all VMs on a host.image

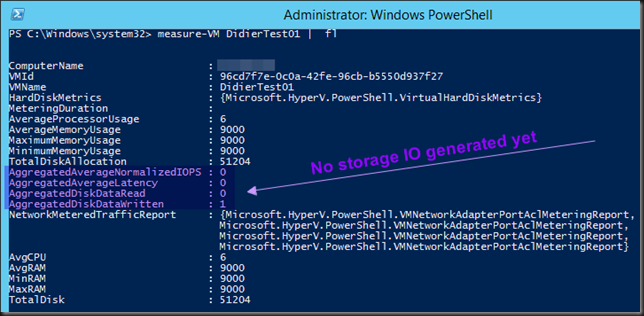
We now run measure-VM DidierTest01 | fl and see that we have no values yet for the properties . Since we haven’t generated any IOPS yes this is normal.image

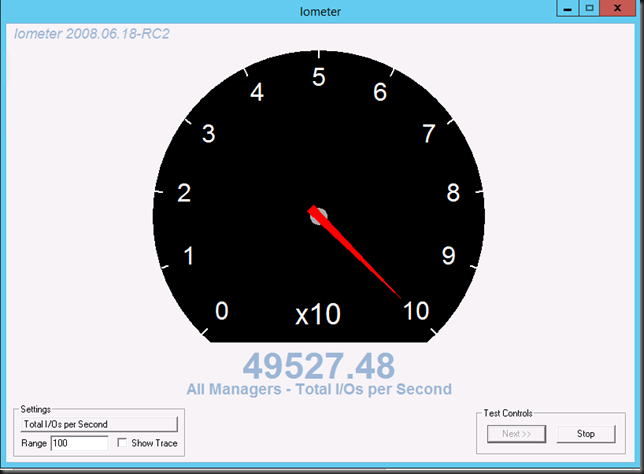
So we now run IOMeter to generate some IOPSimage

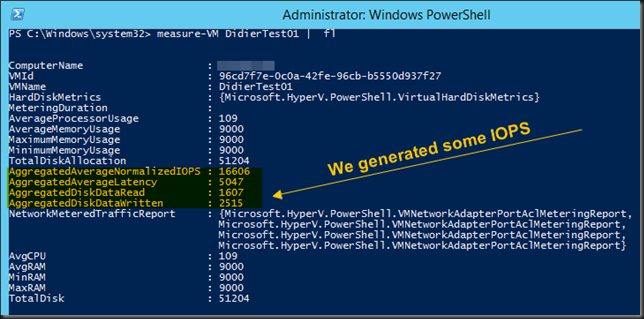
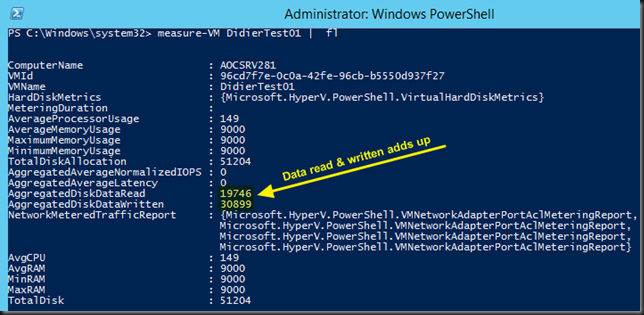
and than run measure-VM DidierTest01 | fl again. We see that the properties have risen.image

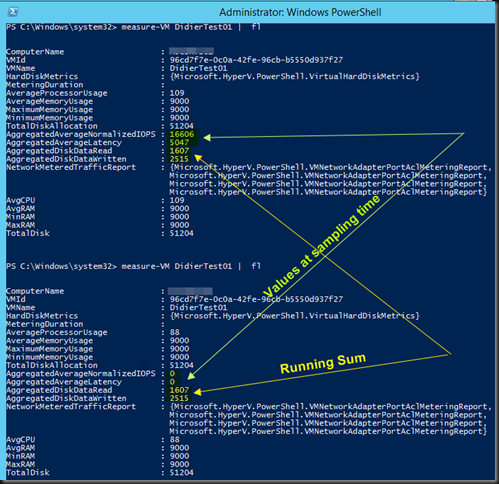
It’s normal that the AggregatedAverageNormalizedIOPS and AggregatedAverageLatency are the averages measured over a period of 20 seconds at the moment of sampling. The value  AggregatedDiskDataRead and AggregatedDiskDataWritten are the averages since we started counting (since we ran Enable-VMResourceMetering for that VM ), it’s a running sum, so it’s normal that the average is lower initially than we expected as the VM was idle between enabling resource metering and generating some IOPS.

All we need to do is keep the VM idle wait 30 seconds so and when we run again measure-VM DidierTest01 | fl again we see the following?image

While the values AggregatedAverageNormalizedIOPS and AggregatedAverageLatency are the value reflecting a 20s average that’s collected at measuring time and as such drop to zero over time. The values for AggregatedDiskDataRead and AggregatedDiskDataWritten are a running sum. They stay the same until we disable or reset resource metering.

Let’s generate some extra IO, after which we wait a while (> 20 seconds) before we run measure-VM DidierTest01 | fl again and get updated information. We confirm see that indeed AggregatedDiskDataRead and AggregatedDiskDataWritten is a running sum and that AggregatedAverageNormalizedIOPS and AggregatedAverageLatency have dropped to 0 again.

image

Anyway, it’s clear to you that the sampled value of AggregatedAverageNormalizedIOPS is what you’re interested in when trying to get a feel for the value you need to set in order to limit a virtual hard disk to an acceptable number of normalized IOPS.

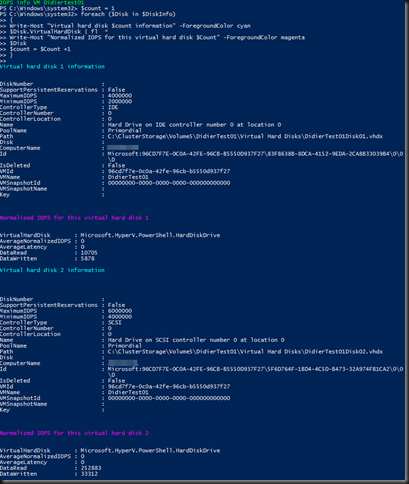
But wait, that’s aggregated! I have SQL Server VMs with 4 virtual hard disks. How do I know what hard disk is generating what IOPS? The docs say the metrics are per virtual hard disk, right?! I need to know if it’s the virtual hard disk with TempDB or the one with the LOGS causing the IO issue.

Well the info is there but it requires a few more lines of PowerShell:

cls
$VMName  = "Didiertest01" 
enable-VMresourcemetering -VMName $VMName 
$VMReport = measure-VM $VMName 
$DiskInfo = $VMReport.HardDiskMetrics
write-Host "IOPS info VM $VMName" -ForegroundColor Green
$count = 1
foreach ($Disk in $DiskInfo)
{
Write-Host "Virtual hard disk $count information" -ForegroundColor cyan
$Disk.VirtualHardDisk | fl  *
Write-Host "Normalized IOPS for this virtual hard disk" -ForegroundColor cyan
$Disk
$count = $Count +1 
}

Resulting in following output:

image

Hope this helps! Windows Server 2012 R2 make life as a virtualization admin easier with nice tools like this at our disposal.

Storage Quality of Service (QoS) In Windows Server 2012 R2

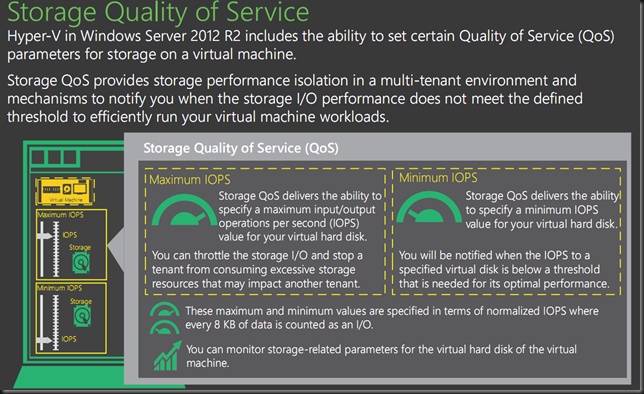
In Windows Server 2012 R2 Hyper-V we have the ability to set  quality-of-service (QoS) options for a virtual machine at the virtual disk level. There is no QoS (yet) for shared VHDX, so it’s a per individual VM, per virtual hard disk associated with that virtual machine setting for now.

What can we do?

  • Limit – Maximum IOPS
  • Reserve – Minimum IOPS threshold alerts
  • Measure – New Storage attributes in VM Metrics

image

Limit

Storage QoS allows you to specify maximum input/output operations per second (IOPS) value for a virtual hard disk associated with virtual machine. This puts a limit on what a virtual disk can use. This means that one or more VMs cannot steal away all IOPS from the others (perhaps even belonging to separate customers). So this is an automatic hard cap.

Reserve

We can also set a minimum IOPS value. This is often referred to as the reserve. This is not hard minimum. Here’s a worth of warning, unless you hopelessly overprovision your physical storage capabilities (ruling out disk, controller issues, HBA problems & other risks that impact deliverable IOPS) and dedicate it to a single Hyper-V host with a single VM (ruling out the unknown) you cannot ever guarantee IOPS. It’s best effort. It might fail but than events will alert you that things are going south. We will be notified when the IOPS to a specified virtual hard disk is below that reserve you specified?that is needed for its optimal performance.  We’ll talk more about this in another blog post.

Measure

The virtual machine metrics infrastructure have been extended with storage related attributes so we can monitor the performance (and so charge or show back).  To do this they use what they call “normalized IOPS” where every 8 K of data is counted as one I/O. This is how the values are measured and set. So it’s just for that purpose alone.

  • One 4K I/O = 1 Normalized I/O
  • One 8K I/O = 1 Normalized I/O
  • One 10K I/O = 2 Normalized I/Os
  • One 16K I/O = 2 Normalized I/Os
  • One 20K I/O = 3 Normalized I/Os

A Little Scenario

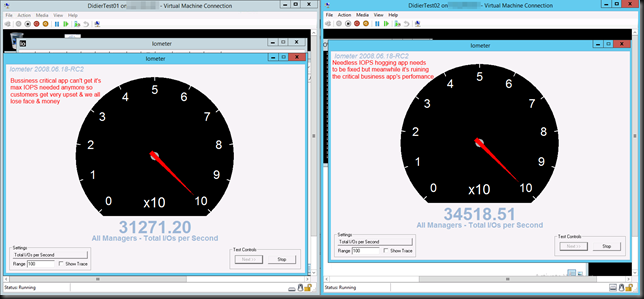
We take IO Meter and we put it inside 2 virtual machines. These virtual machine reside on a Hyper-V Cluster that is leveraging shared storage on a SAN. Let’s say you have a VM that requires 45000 IOPS at times and as long as it can get that when needed all is well.

All is well until one day a project that goes into production has not been designed/written with storage IOPS (real needs & effects) in mind. So while they have no issue the application behaves as a scrounging hog eating a humongous size of the IOPS the storage can deliver.

Now, you do some investigation (pays to be buddies with a good developer and own the entire infrastructure stack) and notice that they don’t need those IOPS as they:

  1. Can do more intelligent data retrieval slashing IOPS in half.
  2. They waste 75% of the time in several suboptimal algorithms for sorting & parsing data anyway.
  3. The number of users isn’t that high and the impact of reducing storage IOPS is non existent due to (2).

All valid excuses to take the IOPS away …You think let’s ask the PM to deal with this. They might, they might not, and if they do it might take time. But while that remains to be seen, you have a critical solution that serves many customers who’re losing real money because of that drop in IOPS has become an issue with the application. So what’s the easiest thing to do? Cap that IOPS hog! Here the video on how you deal with this on Vimeo: http://vimeo.com/82728497

image

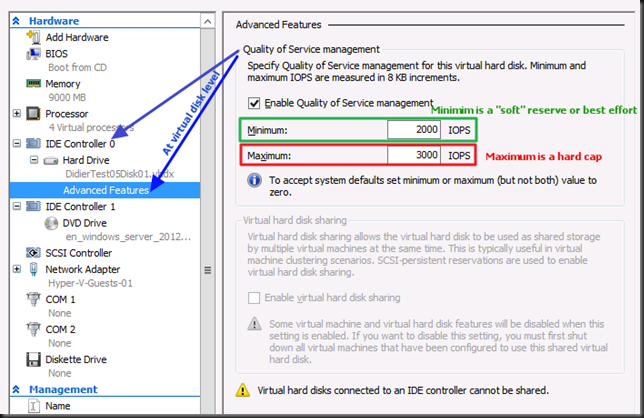
Now let’s enable QoS as in the screenshot below. We give it a best effort 2000 IOPS minimum and a hard maximum of 3000 IOPS.

image

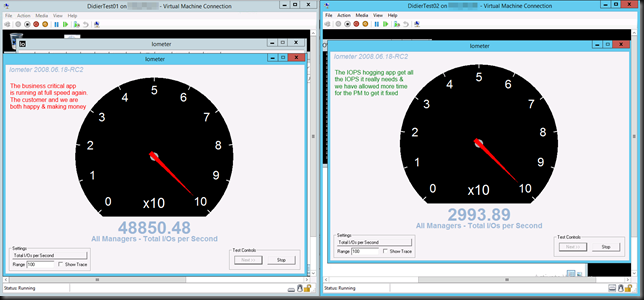
The moment you click “Apply” it kicks in! You can do this live, not service interruption/ system downtime is needed.

image

I actually have a hard cap of 50000 on the business critical app as well just to make sure the other VMs don’t get starved. Remember that minimum is a soft reserve. You get warned but it can’t give what potentially isn’t available. After all, as always, it’s technology, not magic.

In a next blog we’ll discuss QoS a bit more and what’s in play with storage IO management in Hyper-V, what the limitations are and as such we get an idea what Microsoft should pay attention to vNext.

Remarks

Well doing this for a 24 node Hyper-V cluster with 500 VMs could be a bit of challenge.

Windows Server 2012 R2 Cluster Reset Recent Events With PowerShell

I blogged before about the fact that since Windows Server 2012  we have the ability to reset the recent events shown so that the state of the cluster is squeaky clean with not warnings or errors. You can read up on this here. Windows Server 2012 Cluster Reset Recent Events Feature.

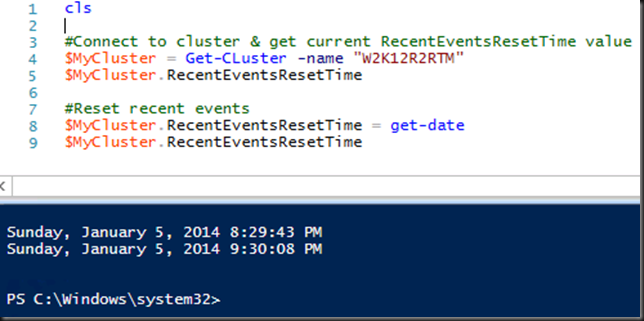
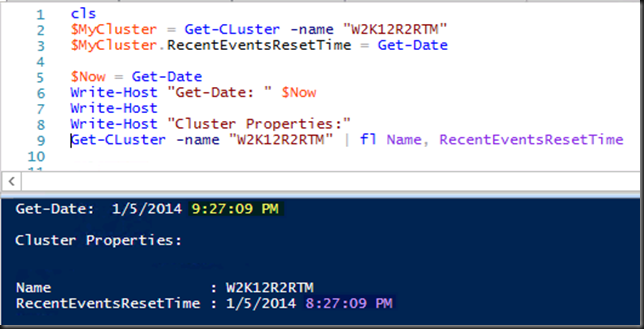
You can also do this in PowerShell like in the example below:

#Connect to cluster & get current RecentEventsResetTime value
$MyCluster = Get-CLuster -name "W2K12R2RTM"
$MyCluster.RecentEventsResetTime

#Reset recent events
$MyCluster.RecentEventsResetTime = get-date
$MyCluster.RecentEventsResetTime

As you may notice, the RecentEventsResetTime is displayed in UTC when read form the cluster after connecting to it. Right after you set it it displays the time respectful of the time zone you’re in right until you connect to the cluster again. We demonstrate this in the 2 screenshots below (I’m at GMT+1).

image

image

This comes in handy when writing test, comparison & demo scripts. Often you do things with the network that causes network connectivity to be lost when the NIC gets reset (disabled/enabled) and such. Also when something fails as part of the demo or tests scripts it’s nice to start the rerun or the next part of the demo/test with a clean cluster GUI when you’re showcasing stuff. Unfortunately an already GUI doesn’t refresh these setting if the reset is not done in the GUI. So you need to open a new one. For scripting you don’t have this issue. EDIT: In Windows 2012 R2 you can use the $MyCluster.Update() to reflect the new value of RecentEventsResetTime in UTC without having to reconnect to the cluster. In Windows Server 2012 this Update method isn’t available but it seems to happen automatic.