Unable to retrieve all data needed to run the wizard. Error details: “Cannot retrieve information from server “Node A”. Error occurred during enumeration of SMB shares: The WinRM protocol operation failed due to the following error: The WinRM client sent a request to an HTTP server and got a response saying the requested HTTP URL was not available. This is usually returned by a HTTP server that does not support the WS-Management protocol.

I was recently configuring a Windows Server 2012 File server cluster to provide SMB transparent failover with continuous available file shares for end users. So, we’re not talking about a Scale Out File Server here.

All seemed to go pretty smooth until we hit a problem. when the role is running on Node A and you are using the GUI on Node A this is what you see:
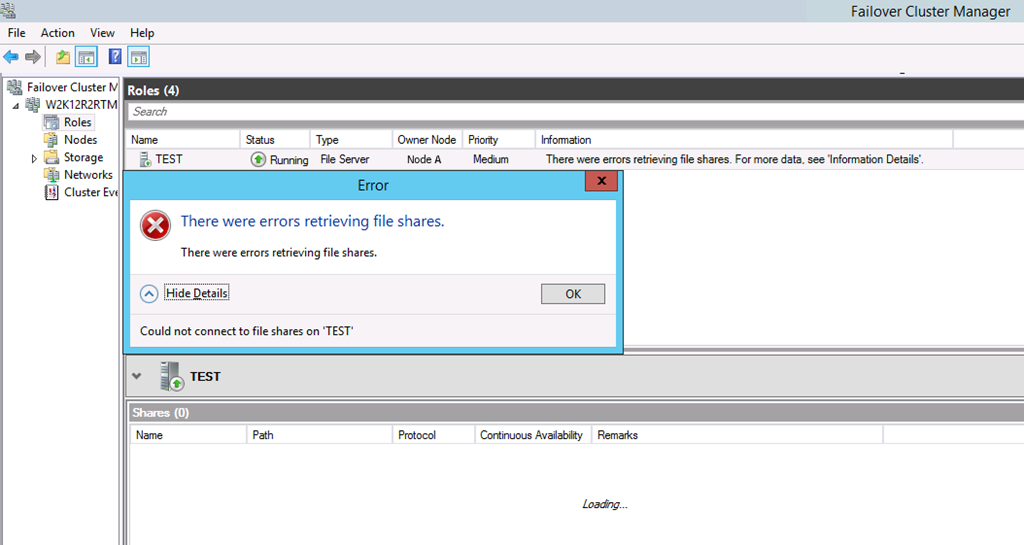
image

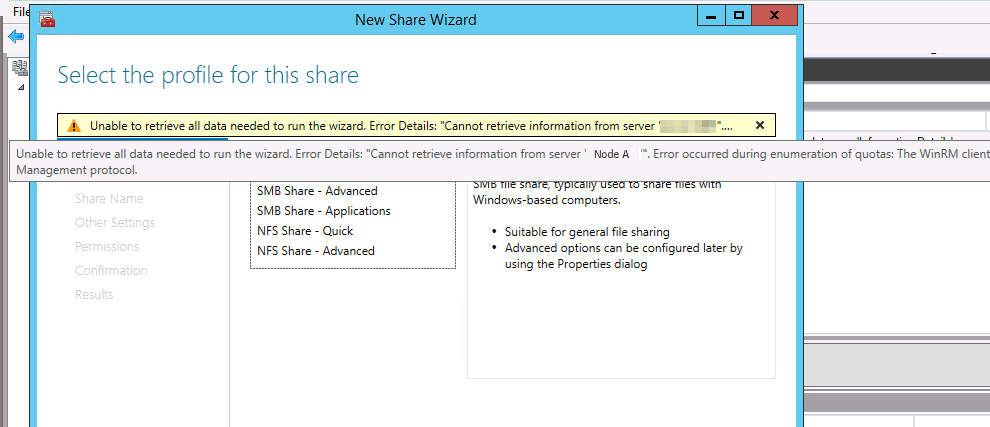
When you try to add a share you get this

"Unable to retrieve all data needed to run the wizard. Error details: "Cannot retrieve information from server "Node A". Error occurred during enumeration of SMB shares: The WinRM protocol operation failed due to the following error: The WinRM client sent a request to an HTTP server and got a response saying the requested HTTP URL was not available. This is usually returned by a HTTP server that does not support the WS-Management protocol.”
image

When you failover the file server role to the other node, things seem to work just fine. So this is where you run the GUI from Node A while the file server role resides on Node B.
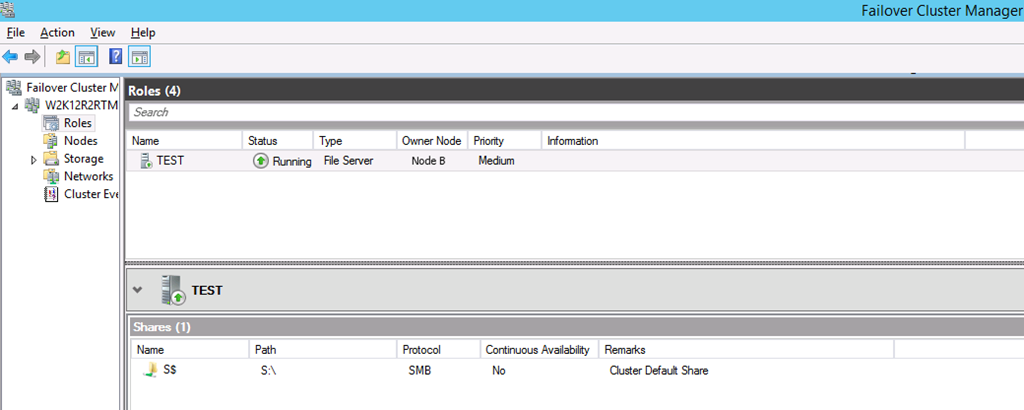
image

You can add a share, it all works. You notice the exact same behavior on the other node. So as long as the role is running on another node than the one on which you use Failover Cluster Manager you’re fine. Once you’re on the same node you run into this issue. So what’s going on?

So what to do? It’s related to WinRM so let’s investigate that.
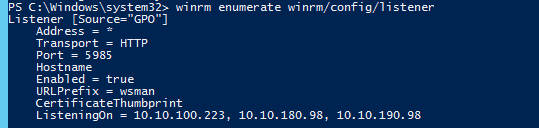
image

So the WinRM config comes via a GPO. The local GPO for this is not configured. So that’s not the one, it must come from the  domain.The IP addresses listed are the node IP and the two cluster networks. What’s not there is local host 127.0.0.1, the cluster IP address or any of the IPV6 addresses.

I experimented with a lot of settings. First we ended up creating an OU in the OU where the cluster nodes reside on which we blocked inheritance. We than ran gpupdate /target:computer /force on both nodes to make sure WinRM was no longer configure by the domain GPO. As the local GPO was not configured it reverted back to the defaults. The listener show up as listing to all IPv4 and IPv6 addresses. Nice but the GPO was now disabled.
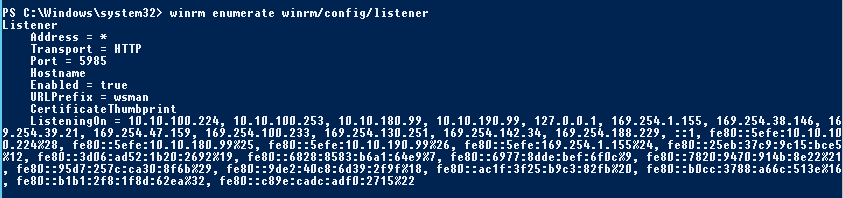
image

This is interesting but, things still don’t work. For that we needed to disable/enable WinRM

Configure-SMRemoting -disable
Configure-SMRemoting –enable

or via server manager
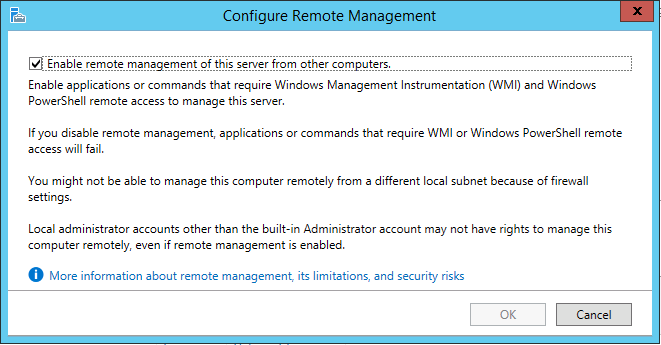
image

That fixed it, and we it seems a necessity to to. Do note that to disable/enable remote management it should not be configured via a GPO or it throws an error like
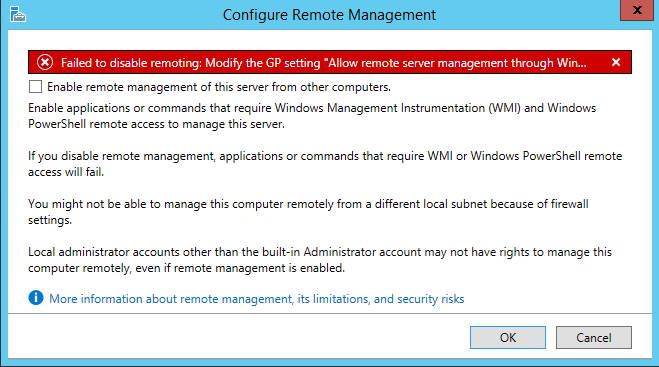
image

or

image

Some more testing

We experimented by adding 127.0.0.0-172.0.0.1 an enabling the GPO again. We then saw the listener did show the local host, cluster & file role IP address but the issue was back. Using * in just IPv 4 did not do the trick either.

image

What did the trick was to use * in the filter for IPv 6 and keep our original filters on IPv4. The good news is that having removed the GPO and disabling/enabling WinRM  the cluster IP address & Filer Role IP address are now in the list. That could be good for other use cases.

This is not ideal, but it all works now.

What we settled for

So we ended up with still restricting the GPO settings for IPv4 to subnet ranges and allowing * for IPv6. This made sure that even when we run the Failover Cluster Manager GUI from the node that owns the file server role everything still works.

One workaround is to work from a remote host, not from a cluster member, which is a good practice anyway.

The key takeaway is that when Microsoft says they test with IPv6 enabled they literally mean for everything.

Note

There is a TechNet article on WinRM GPO Settings for SCVMM 2012 RC where they advice to set both IPv4 and  IPv6  to * to avoid issues with SCVMM operations. How to Add Trusted Hyper-V Hosts and Host Clusters in VMM 

However, we found that IPv6 is the key requirement here, * for just IP4 alone did not work.

How To Monitor Storage QoS Minimum IOPS & Identify VM & The Virtual Hard Disk In Windows Server 2012 R2 Hyper-V

At TechEd 2013 John Matthew & Liang Yang presented following session  MDC-B345: Windows Server 2012 Hyper-V Storage Performance. That was a great one. During this they demonstrated the use of WMI to monitor storage alerts related to Storage QoS in Windows Server 2012 R2. We’re going to go further, dive in a bit deeper and show you how to identify the virtual hard disk and the virtual machine.

One important thing in all this is that we need to have the reserve or minimum IOPS not being met, so we run IOMeter to make sure that’s the case. That way the events we need will be generated. It’s a bit of a tedious exercise.

So we start with a wmi notification query, this demonstrates that notifications are sent when the minimum IOPS cannot be met. The query is simply:

select * from Msvm_StorageAlert

image

instance of Msvm_StorageAlert
{
    AlertingManagedElement = "\\TESTHOST01\root\virtualization\v2:Msvm_ResourcePool.InstanceID="Microsoft:70BB60D2-A9D3-46AA-B654-3DE53004B4F8"";
    AlertType = 3;
    Description = "Hyper-V Storage Alert";
    EventTime = "20140109114302.000000-000";
    IndicationTime = "20140109114302.000000-000";
    Message = "The ‘Primordial’ Hard Disk Image pool has degraded Quality of Service. One or more Virtual Hard Disks allocated from the pool is not reporting sufficient throughput as specified by the IOPSReservation property in its Resource Allocation Setting Data.";
    MessageArguments = {"Primordial"};
    MessageID = "32930";
    OwningEntity = "Microsoft-Windows-Hyper-V-VMMS";
    PerceivedSeverity = 3;
    ProbableCause = 50;
    ProbableCauseDescription = "One or more VHDs allocated from the pool (identified by value of AlertingManagedElement property) is experiencing insufficient throughput and is not able to meet its configured IOPSReservation.";
    SystemCreationClassName = "Msvm_ComputerSystem";
    SystemName = "TESTHOST01";
    TIME_CREATED = "130337413826727692";
};

That’s great, but what virtual hard disk of what VM is causing this? That’s the question we’ll dive into in this blog. Let’s go. On MSDN docs on Msvm_StorageAlert class we read:

Remarks

The Hyper-V WMI provider won’t raise events for individual virtual disks to avoid flooding clients with events in case of large scale malfunctions of the underlying storage systems.

When a client receives an Msvm_StorageAlert event, if the value of the ProbableCause property is 50 (“Storage Capacity Problem“), the client can discover which virtual disks are operating outside their QoS policy by using one of these procedures:

Query all the Msvm_LogicalDisk instances that were allocated from the resource pool for which the event was generated. These Msvm_LogicalDisk instances are associated to the resource pool via the Msvm_ElementAllocatedFromPool association.
Filter the result list by selecting instances whose OperationalStatus contains “Insufficient Throughput”.

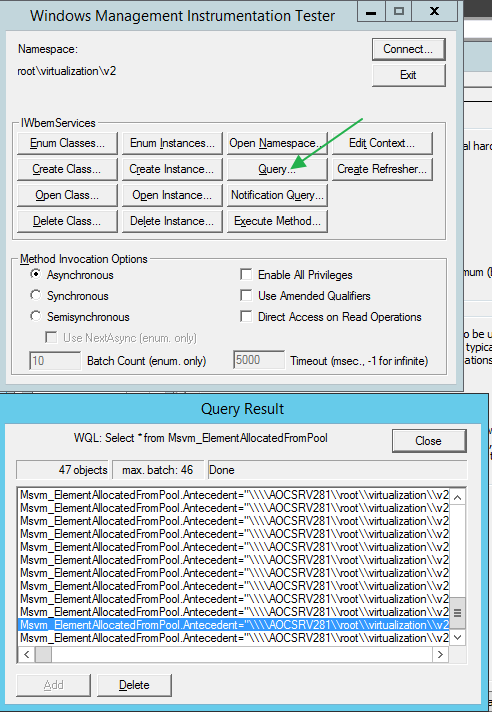
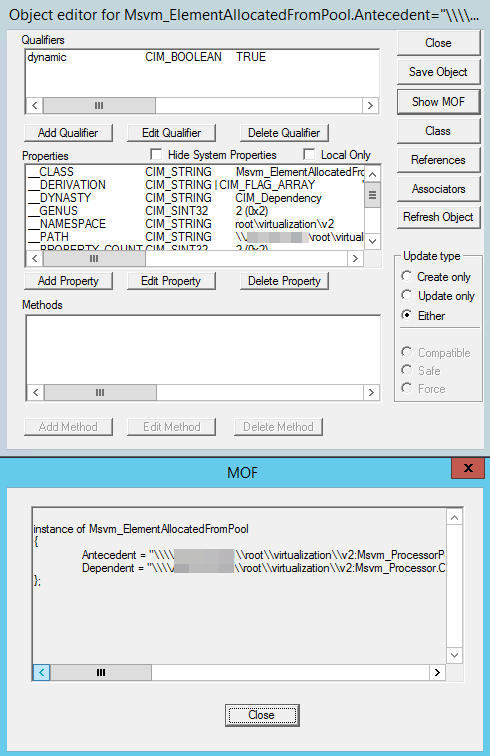
So I query  (NOT a notification query!) the Msvm_ElementAllocatedFromPool class, click through on a result and select Show MOF.

image

image


Let’s look at that MOF …In yellow is the GUID of our VM ID. Hey cool!

instance of Msvm_ElementAllocatedFromPool
{
    Antecedent = "\\TESTHOST01\root\virtualization\v2:Msvm_ProcessorPool.InstanceID="Microsoft:B637F347-6A0E-4DEC-AF52-BD70CB80A21D"";
    Dependent = "\\TESTHOST01\root\virtualization\v2:Msvm_Processor.CreationClassName="Msvm_Processor",DeviceID="Microsoft:b637f346-6a0e-4dec-af52-bd70cb80a21d\\6",SystemCreationClassName="Msvm_ComputerSystem",SystemName="
96CD7F7E-0C0A-42FE-96CB-B5550D937F27"";
};

Now we want to find the virtual hard disk in question! So let’s do what the docs says and query Msvn_LogicalDisk based on the VM GUID we find the relates results …

image

Look we got OperationalStatus 32788 which means InsufficientThroughput, cool we’re on the right track … now we need to find what virtual disk of our VM  that is. Well in the above MOF we find the device ID:     DeviceID = "Microsoft:5F6D764F-1BD4-4C5D-B473-32A974FB1CA2\\L"

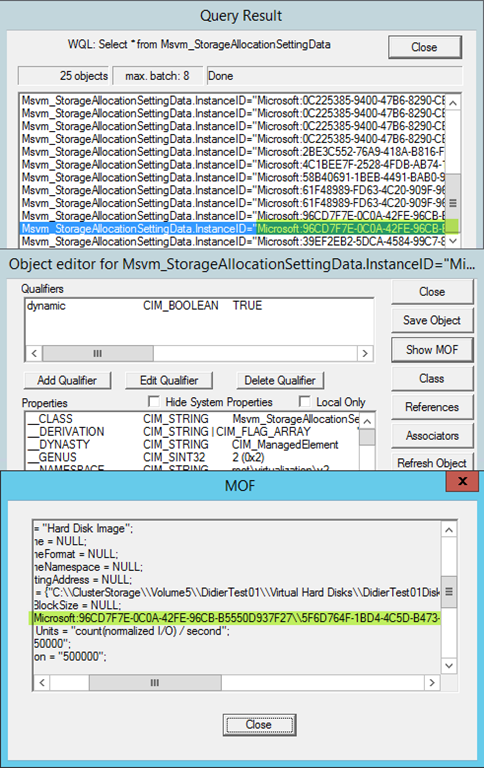
Well if we then do a query for Msvm_StorageAllocationSettingData we find two entrties for our VM GUID (it has two disks) and by looking at the value InstanceID that contains the above DeviceID we find the virtual hard disk info we needed to identify the one not getting the minimum IOPS.

image

HostResource = {"C:\ClusterStorage\Volume5\DidierTest01\Virtual Hard Disks\DidierTest01Disk02.vhdx"};
HostResourceBlockSize = NULL;
InstanceID = "Microsoft:96CD7F7E-0C0A-42FE-96CB-B5550D937F27\5F6D764F-1BD4-4C5D-B473-32A974FB1CA2\\L";

Are you tired yet? Do you realize you need to do this while the disk IOPS is not being met to see the events. This is no way to it in production. Not on a dozen servers, let alone on a couple of hundred to thousands or more hosts is it? All the above did was give us some insight on where and how. But using wbemtest.exe to diver deeper into wmi notifications/events isn’t really handy in real life. Tools will need to be developed to deal with this larger deployments. The can be provided by your storage vendor, your VAR, integrator or by yourself if you’re a large enough shop to make private cloud viable or if you are the cloud provider Smile.

To give you an idea on how this can be done there is some demo code on MSDN over here and I have that compiled for demo purposes.

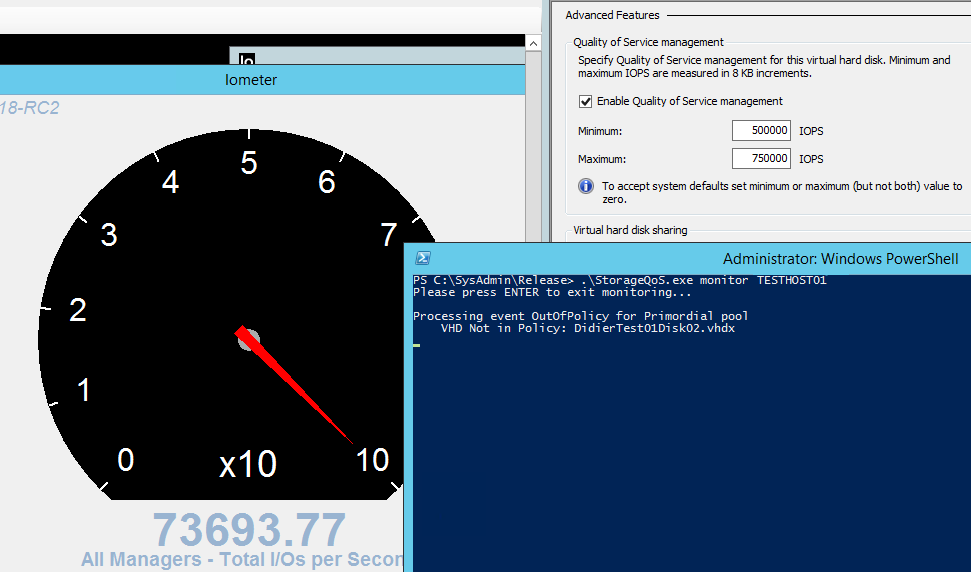
We have 4 VMs running on the host.  One of them is being hammered by IOMeter while it’s minimum IOPS have been set to an number it cannot possibly get. We launch StorageQos to monitor our Hyper-V host.

image

Just let it run and when the notification event that the minimum IOPS cannot be delivered on the storage this monitor will query WMI further to tell us what virtual disk or disks are  involved.  Cool huh! A good naming convention can help identify the VM and this tools works remotely against node so you can launch one for each node of the cluster. Time to fire up Visual Studio 2013 me thinks or go and chat to a good dev you might know to take this somewhere, some prefer this sort of work to the modern day version of CRUD apps any day. If you buy monitoring tools you might want them to have this capability.

While this is just demo code, it gives you an idea of how tools and solutions can be developed & build to monitor the Minimum IOPS part of Storage QoS in Windows Server 2012 R2. Hope you found this useful!

Windows Server 2012 R2 Cluster Reset Recent Events With PowerShell

I blogged before about the fact that since Windows Server 2012  we have the ability to reset the recent events shown so that the state of the cluster is squeaky clean with not warnings or errors. You can read up on this here. Windows Server 2012 Cluster Reset Recent Events Feature.

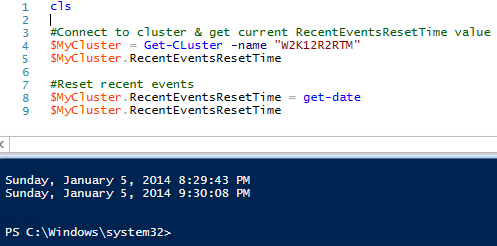
You can also do this in PowerShell like in the example below:

#Connect to cluster & get current RecentEventsResetTime value
$MyCluster = Get-CLuster -name "W2K12R2RTM"
$MyCluster.RecentEventsResetTime

#Reset recent events
$MyCluster.RecentEventsResetTime = get-date
$MyCluster.RecentEventsResetTime

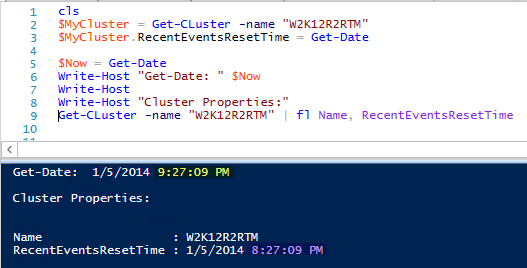
As you may notice, the RecentEventsResetTime is displayed in UTC when read form the cluster after connecting to it. Right after you set it it displays the time respectful of the time zone you’re in right until you connect to the cluster again. We demonstrate this in the 2 screenshots below (I’m at GMT+1).

image

image

This comes in handy when writing test, comparison & demo scripts. Often you do things with the network that causes network connectivity to be lost when the NIC gets reset (disabled/enabled) and such. Also when something fails as part of the demo or tests scripts it’s nice to start the rerun or the next part of the demo/test with a clean cluster GUI when you’re showcasing stuff. Unfortunately an already GUI doesn’t refresh these setting if the reset is not done in the GUI. So you need to open a new one. For scripting you don’t have this issue. EDIT: In Windows 2012 R2 you can use the $MyCluster.Update() to reflect the new value of RecentEventsResetTime in UTC without having to reconnect to the cluster. In Windows Server 2012 this Update method isn’t available but it seems to happen automatic.

Don’t Let Live Migration Settings Behavior Confuse You

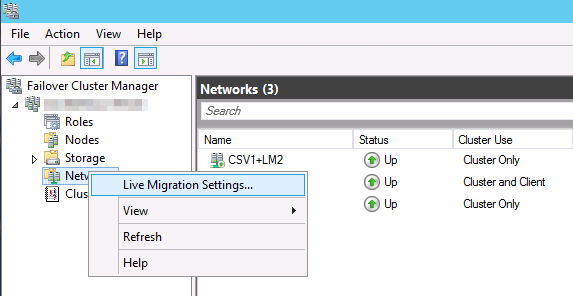
Configuring live migration settings on a cluster

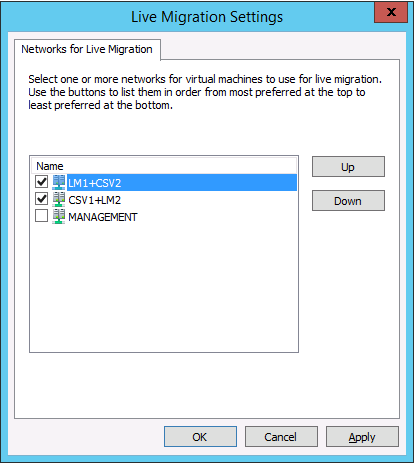
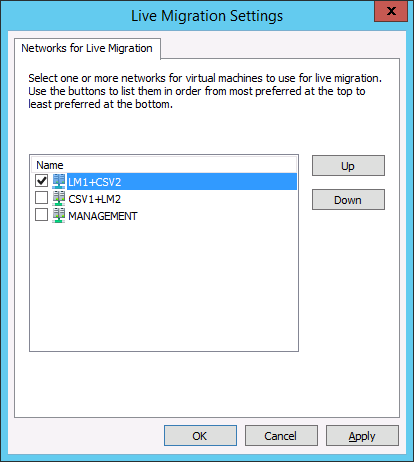
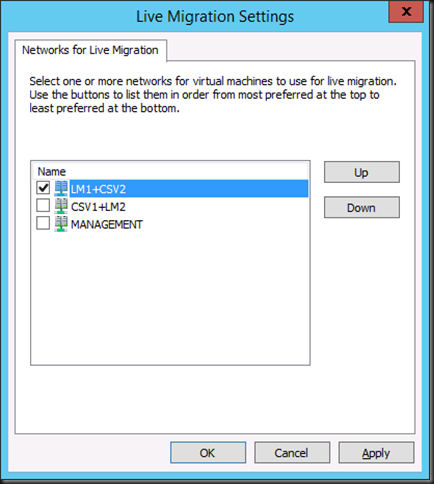
In the cluster under Networks, Live Migration Settings you can select what networks are available for live migration and their order of preference.image

image

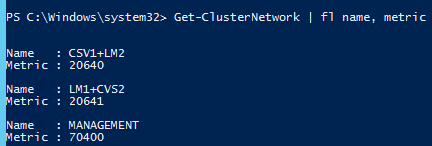
Basically this setting determines what NICs can be used. It also determines and in what order of preference the available networks can be used by Live Migration. It does not determine bandwidth aggregation or failover. All it does is provide the order in which the redundant networks will be used. It’s up to the cluster service NETFT, Multichannel or SMB Direct to provide the bandwidth aggregation if possible As you can see we use LM/CSV over SMB and as our two NICS are RDMA capable 10Gbps NIC, multichannel will discover RDMA capabilities & leverage SMB Direct if it can be establish otherwise it will just stick with multichannel. If you would  team that NIC shows up as just one network. Also not that if you lose a NIC during live migration it might fail for some VMs under certain scenarios, but you cluster nodes will maintain the capability & recover. The  names of the network reflect this: LM1+CSV2 & CSV1+LM2 will be used both but if for some reason multichannel goes completely south the names reflect the metrics of these networks. The lowest is CSV1+LM2 and the second lowest is LM1+CSV2, reflect on how NETFT will select to use which automatically based on the metrics. I.e. It’s “self documentation” for human consumption.

image

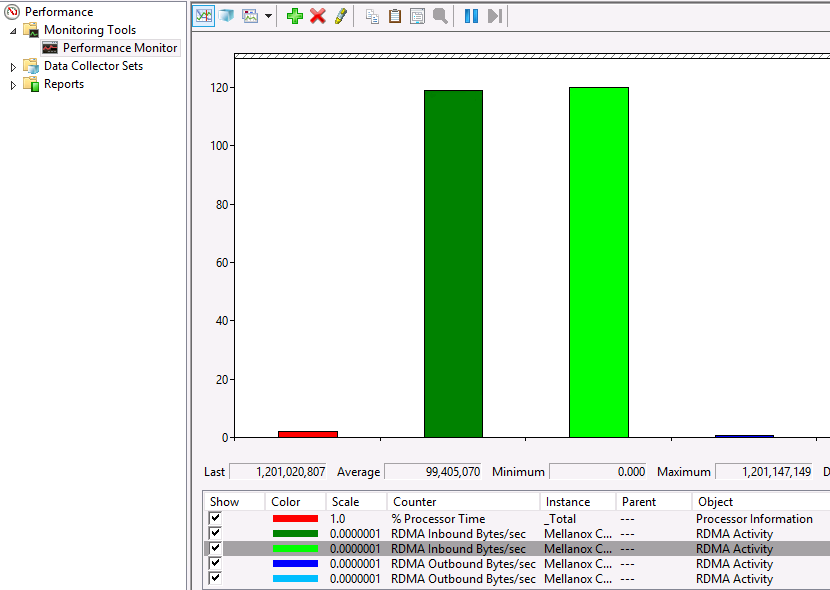
Sometimes you might get surprising results. An example. If you’ve selected SMB for Live Migration and you have selected only one of the NICs here.image Still when you look at perform you might see both being used! What’s happening is that multichannel will kick in (and use two or more similar NICs when it finds them and if applicable move to RDMA.

image

So here we select SMB for the live migration type and the two equally capable 10GBps NICs available for live migration it will use them, even if you selected only one of them in the cluster network settings for live migration.

Why is that? Well, there is still another location where live migration settings are defined and that is in Hyper-V Manager. Take a look at the screenshot below.

image

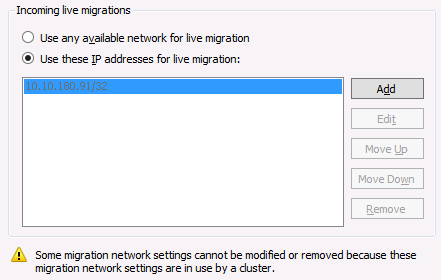
The Incoming live migration settings is set to “Use any available network for live migration”. If you have this on it will still leverage both as when one is used multichannel drag the other one into action anyway, no matter what you set in network settings for live migration in the Cluster GUI (it set to use only one and dimmed out).

Do note that on Hyper-V Manager the settings for live migrations specify “Incoming live migrations”. That leads us to believe that it’s the target, the node where the VMs are migrated to that determines what NICs get used. But let’s put this to the test.

Testing A Hyper-V cluster with two nodes – Node A and Node B

On the cluster network settings you select only one network.

image

On  Hyper-V cluster Node A you have configured the following for live migration via Hyper-V Manager to “Use these IP addresses for live migration”. You cannot add or remove networks, the networks used are defined by the cluster.

image

On  Hyper-V cluster Node B you have configured the following for live migration via Hyper-V Manager to “Use any available network for live migration”.

As we now kick of a live migration from node A to node B we’ll see both NICs being used. Why well because Node B is the target and Node B has the setting “Use any available network for live migration”. So why then only these 2, why not pick up any other suitable NICs? Well we’ve configured the live migration on both nodes to use SMB. As this cluster is RDMA capable that means it will leverage multichannel/SMB direct. The auto configuration will select the best, equally capable NICs for this and that’s these two in our scenario. Remember the capabilities of the NICs have to match. So no mixtures of 1 * 1Gbps and 1 *10Gbps or 1 * multichannel and 1 SMB Direct.

The confusion really sets in that even if live migrate from Node B to A it will also use both NICs! Hum, that is “Incoming Live Migrations” is not always “correct” it seems, not when using SMB as a performance option at least. Apparently multichannel will kick in in both directions.

If you set both to Node A and Node B to “Use these IP addresses for live migration” and leave the cluster network setting with only one network it does only use one, even with SMB as a performance option for live migration. This is expected.

Note: I had one interesting hiccup while testing this configuration: when doing the latter one of the VMs failed in live migration of the entire host. I ran it again and that one VM still used both networks. All others went well during host migration with just one being used. That was a bit of a huh Confused smile moment and it sure tripped me up & kept me busy for a while. I blame RDMA and the position of the planets & constellations.

Things aren’t always what they seem at first and it’s good to keep that in mind. The moment you think you got if figured out, you’re wrong Winking smile. So look again & investigate.