High performance live migration done right means using SMB Direct

I  saw people team two 10GBps NICs for live migration and use TCP/IP. They leveraged LACP for this as per my blog Teamed NIC Live Migrations Between Two Hosts In Windows Server 2012 Do Use All Members . That was a nice post but not a commercial to use it. It was to prove a point that LACP/Static switch dependent teaming did allow for multiple VMs to be live migrated in the same direction between two node. But for speed, max throughput & low CPU usage teaming is not the way to go. This is not needed as you can achieve bandwidth aggregation and redundancy with SMB via Multichannel. This doesn’t require any LACP configuration at all and allows for switch independent aggregation and redundancy. Which is great, as it avoids stacking with switches that don’t do  VLT, MLAG,  …

Even when your team your NICs your better off using SMB. The bandwidth aggregation is often better. But again, you can have that without LACP NIC teaming so why bother? Perhaps one reason, with LACP failover is faster, but that’s of no big concern with live migration.

We’ll do some simple examples to show you why these choices matter. We’ll also demonstrate the importance of an optimize RSS configuration. Do not that the configuration we use here is not a production environment, it’s just a demo to show case results.

But there is yet another benefit to SMB.  SMB Direct.  That provides for maximum throughput, low latency and low CPU usage.

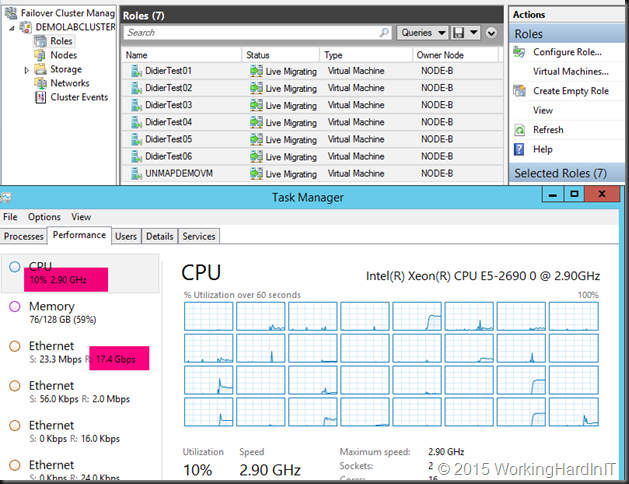
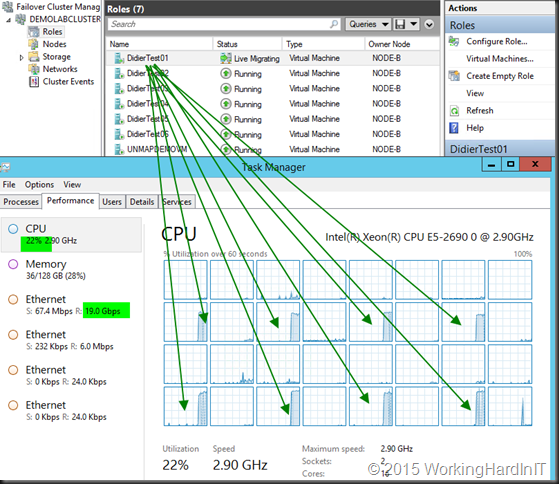
LACP NIC TEAM with 2*10Gbps with TCP

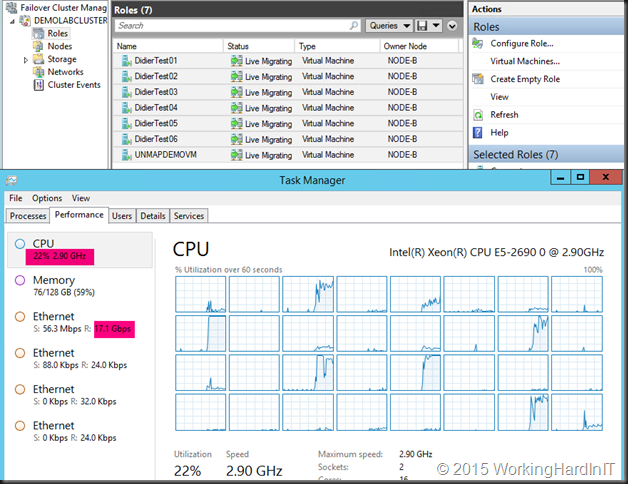
With RSS setting on the inbox default we have problems reaching the best possible throughput (17Gbps). But that’s not all. Look at the CPU at the time of live migration. As you can see it’s pretty taxing on the system at 22%.

image

If we optimize RSS with 8 RSS queues assigned to 8 physical cores per NIC on a different CPU (dual socket, 8 core system) we sometimes get better CPU overhead at +/- 12% but the throughput does not improve much and it’s not very consistent. It can get worse and look more like the above.

image

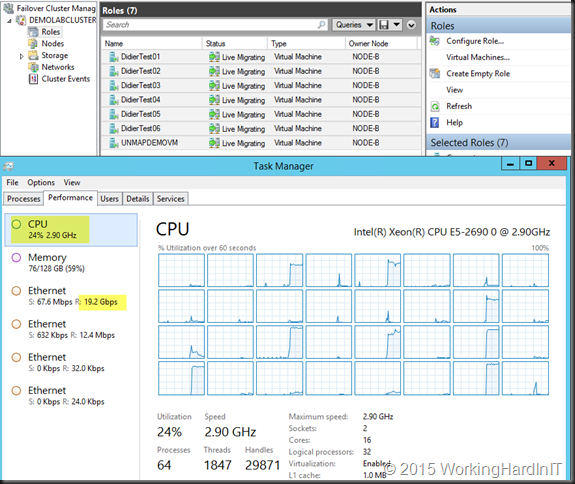
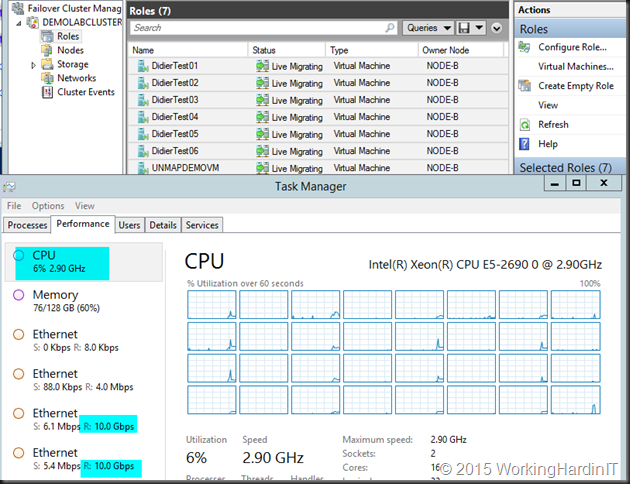
LACP NIC TEAM with 2*10Gbps with SMB (Multichannel)

With the default RSS Settings we still have problems reaching the best possible throughput but it’s better (19Gbps). CPU wise, it’s pretty taxing on the system at 24%.

image

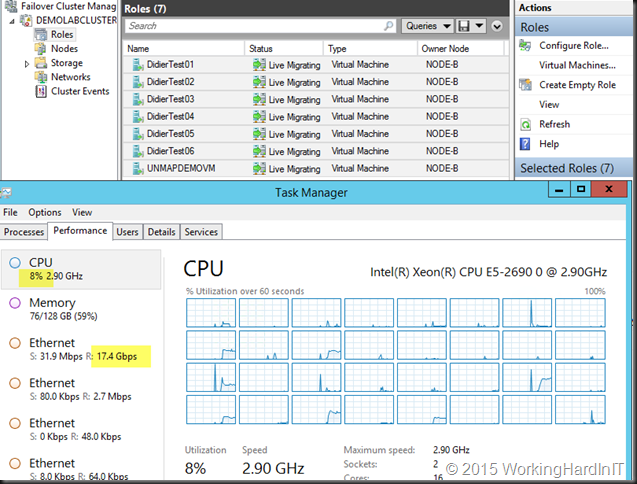
If we optimize RSS with 8 RSS queues assigned to 8 physical cores per NIC on a different CPU (dual socket, 8 core system) we get better over CPU overhead at +/- 8% but the throughput actually declined (17.5 %). When we run the test again we were back to the results we saw with default RSS settings.

image

Is there any value in using SMB over TCP with LACP for live migration?

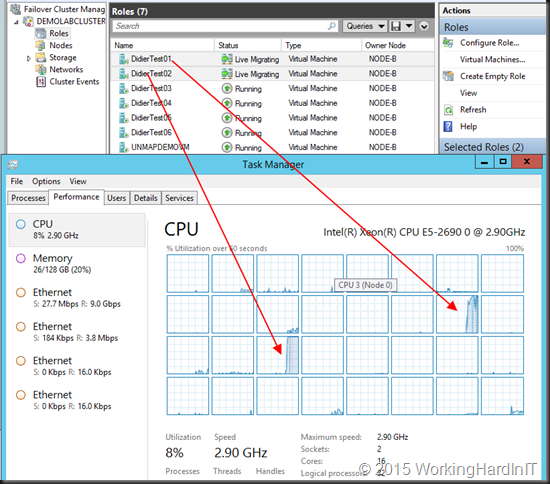
Yes there is. Below you see two VMs live migrate, RSS is optimized. One core per VM is used and the throughput isn’t great, is it. Depending on the speed of your CPU you get at best 4.5 to 5Gbps throughput per VM as that 1 core per VM is the limiting factor. Hence see about 9Gbps here, as there’s 2 VMs, each leveraging 1 core.

image

Now look at only one VM with RSS is optimized with SMB over an LACP NIC team. Even 1 large memory VM leverages 8 cores and achieves 19Gbps.

image

What about Switch Independent Teaming?

Ah well that consumes a lot less CPU cycles but it comes at the price of speed. It has less CPU overhead to deal with in regards to LACP. It can only receive on one team member. The good news is that even a single VM can achieve 10Gbps (better than LACP) at lower CPU overhead. With SMB you get better CPU distribution results but as the one member is a bottle neck, not faster. But … why bother when we have …better options!? Read on Smile!

No Teaming – 2*10Gbps with SMB Multichannel, RSS Optimized

We are reaching very good throughput but it’s better (20Gbps) with 8 RSS queues assigned to 8 physical cores. The CPU at the time of live migration is pretty good at 6%-7%.

image

Important: This is what you want to use if you don’t have 10Gbps but you do have 4* 1Gbps NICs for live migration. You can test with compression and LACP teaming if you want/can to see if you get better results. Your mirage may vary Smile. If you have only one 1Gbps NIC => Compression is your sole & only savior.

2*10Gbps with SMB Direct

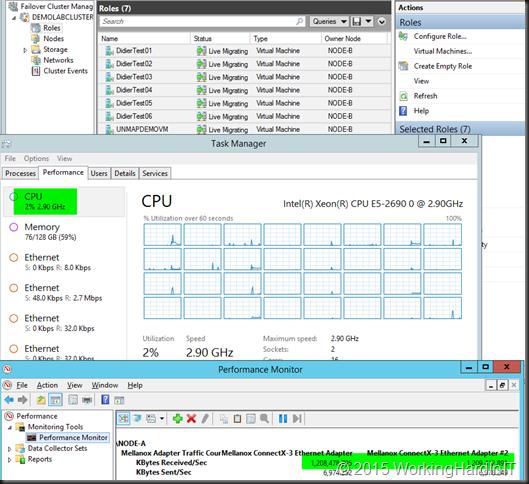
We’re using perfmon here to see the used bandwidth as RDMA traffic does not show up in Task Manager.

image

We have no problems reaching the best possible throughput but it’s better (20Gbps, line speed). But now look at the CPU during live migration. How do you like them numbers?

Do not buy non RDMA capable NICs or Switches without DCB support!

These are real numbers, the only thing is that the type and quality of the NICs, firmware and drivers used also play a role an can skew the results a bit. The onboard LOM run of the mill NICs aren’t always the best choice. Do note that configuration matters as you have seen. But SMB Direct eats them all for breakfast, no matter what.

Convinced yet? People, one of my core highly valuable skillsets is getting commodity hardware to perform and I tend to give solid advice. You can read all my tips for fast live migrations here in Live Migration Speed Check List – Take It Easy To Speed It Up

Does all of this matter to you? I say yes , it does. It depends on your environment and usage patterns. Maybe you’re totally over provisioned and run only very small workloads in your virtual machines. But it’s save to say that if you want to use your hardware to its full potential under most circumstances you really want to leverage SMB Direct for live migrations. What about that Hyper-V cluster with compute and storage heavy applications, what about SQL Server virtualization? Would you not like to see this picture with SMB RDMA? The Mellanox  RDMA cards are very good value for money. Great 10Gbps switches that support DCB (for PFC/ETS) can be bought a decent prices. You’re missing out and potentially making a huge mistake not leveraging SMB Direct for live migrations and many other workloads. Invest and design your solutions wisely!

Testing Virtual Machine Compute Resiliency in Windows Server 2016

No matter what high quality gear you use, how well you design your environment and how much redundancy you build in you will see transient failures in your environment at one point in time. In combination with the push to ever more commodity hardware and the increased use of converged deployments leveraging Ethernet transient failures have become more frequent occurrence then they used to be.

Failover clustering by tradition reacts very “assertive” to failures in order to provide high to continuous availability to our virtual machines. That’s great, we want it to do that, but this binary approach comes at a cost under certain conditions. When reacting too fast and too proactively to transient failures we actually can get  less high or continuous availability in certain scenarios than if the cluster would just have evaluated the situation a bit more cautiously. It’s for this reason that Microsoft introduced increased “Virtual Machine Compute Resiliency” to deal with intra-cluster communication failures in a Windows Server 2016 cluster.

I have helped out a number of fellow MVPs over the past 6 months with this new feature and I dove back into my lab notes to blog about this and help you out with your own testing. The early work was done with Technical Preview v1. In that release it was disabled by default (the value for cluster property “ResiliencyDefaultPeriod”  was set to 0) and the keyword “Default” was used in cluster property “resiliencylevel” for the what is now called ‘IsolateOnSpecialHeartbeat’ and is no longer the default at installation. If that doesn’t confuse you yet, I’ll find another reason to tell you to move to technical preview v2. In TPv2 Virtual Machine Compute Resiliency is enabled and configured by default but in TPv1 you had to enable and configure it yourself. I  advise you to stop testing with v1 and move to v2 and future technical preview release in order for you to test with the most recent bits and functionality.

Investigating the feature configuration

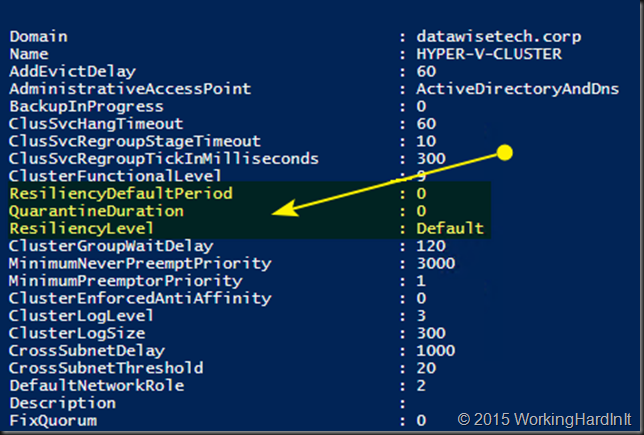
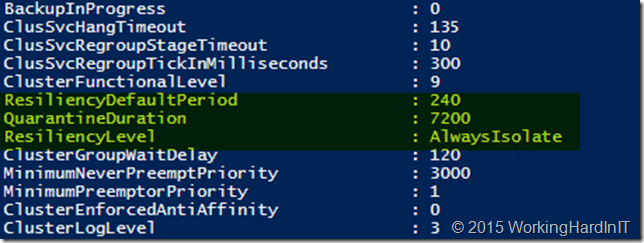
When testing new features in Windows Server Technical Preview Hyper-V you’re on your own once in a while as much is not documented yet. Playing around with PowerShell helps you discover stuff. A  Get-Cluster  | fl * teaches us all kinds of cool stuff such as these new cluster properties:

ResiliencyDefaultPeriod
QuarantineDuration
ResiliencyLevel

Here’s a screenshot of Windows Server 2016TPv1 (Please stop using this version and move to TPv2!)

image

Now when you’re running Windows Server 2016TP v2 this feature has been enabled by default (ResilienceyDefaultPeriod has been filled out as well as QuarantineDuration) and the resiliency level has been set to “AlwaysIsolate”.

image

After some lab work with this I figured out what we need to know to make VM Compute Resiliency to work in our labs:

  • Make sure your cluster functional level is running at version 9
  • Make sure your VMs are at version 6.X
  • Make sure the Operating systems of the VM is Windows Server Technical Preview v2 (Again move away from TPv1)
  • Enable Isolation/Quarantine via PowerShell:

(get-cluster).resiliencylevel
(get-cluster).resiliencylevel = ‘AlwaysIsolate’ or 2
(get-cluster).resiliencylevel
(get-cluster).resiliencylevel = ‘IsolateOnSpecialHeartbeat’  or  1
(get-cluster).resiliencylevel

Please note that all nodes need to be on line to make this change in the technical preview. I got the two accepted values by trial and error and the blog by Subhasish Bhattacharya confirms these are the only 2 ones.

  • Set the timings to some not too high and not too low value to play in the lab without having to wait to long before it’s back to normal (the values I use in my current Technical Preview lab environment are not a recommendation whatsoever, they only facilitate my testing and learning, this has nothing to do with any production environment) . For lab testing I chose:

(get-cluster).ResiliencyDefaultPeriod = 60  Note that setting this to 0 reverts you back to pre Windows Server 2016 behavior and actually disables this feature. The default is 240 seconds

(get-cluster).QuarantineDuration = 300 The default is 7200 seconds, but I’m way to impatient in my lab for that so I set the quarantine duration lower as I want to see the results of my experiments fast, but beware of just messing with this duration in production without thinking about it. Just saying!

Testing the feature and its behaviour

Then you’re ready to start abusing your cluster to demo Isolation mode & quarantine. I basically crash the Cluster service on one of the nodes in the cluster.  Note that cleanly stopping the service is not good enough, it will nicely drain that node for you. which is not what we want to see. Crash it of force stop it via stop-process -name clussvc –Force.

So what do we see happen:

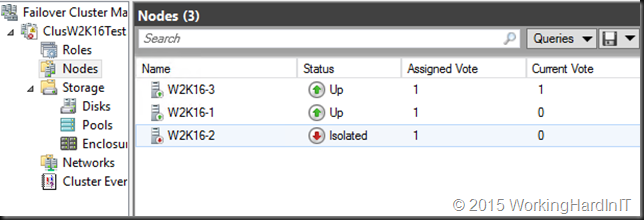
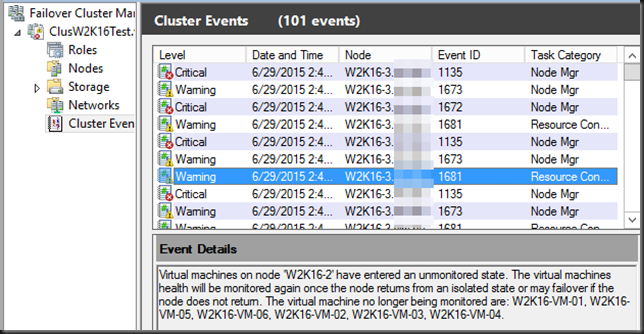
    • The node on which we crashed the cluster server experiences a “transient” intra-cluster communication failure. This node is placed into an Isolated state and removed from its active cluster membership.

image

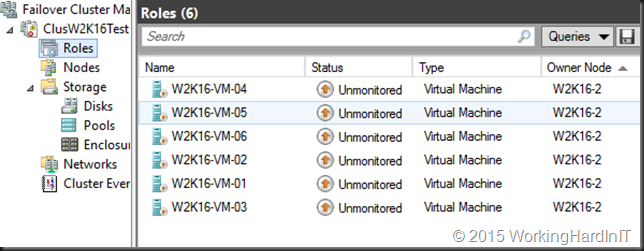
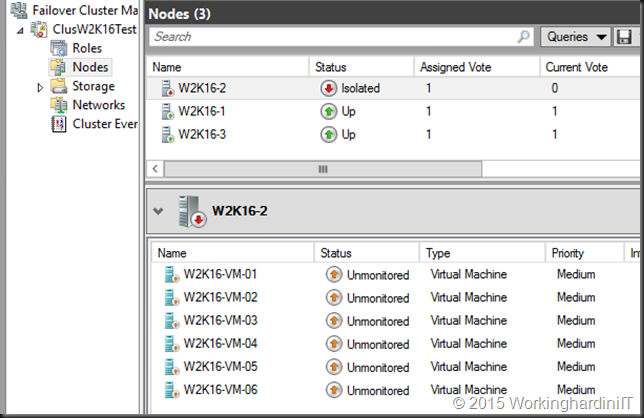
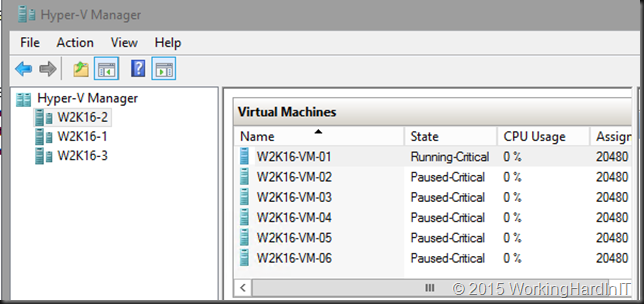
  • The VMs running at version 6.2 go into Unmonitored state. The other ones just fail over. Unmonitored means you that the cluster is no longer actively managing the VM but you can still look at the condition of the VM via PowerShell or Hyper-V manager. image

image

image

Based on the type of storage you’re using for your VMs the story is different:

  1. File Storage backed (SMB3/SOFS): The VM continues to run in the Online state. This is possible because the SMB share itself has no dependency on the Hyper-V cluster. Pretty cool!
  2. Block Storage backed (FC / FCoE / iSCSI / Shared SAS / PCI RAID)): The VMs go to Running-Critical and then placed in the Paused Critical state. As you have a intra-cluster communication failure (in our case losing the cluster service) the isolated node no longer has access to the Cluster Shared Volumes in the cluster and this is the only option there is.

image

  • If the isolated node doesn’t recover from this presumed transient failure it will, after the time specified in ResiliencyDefaultPeriod (default of 4 minutes : 240 s) go into a down state. The VMs fail over to another node in the cluster. Normally during this experiment the cluster service will come back on line automatically.
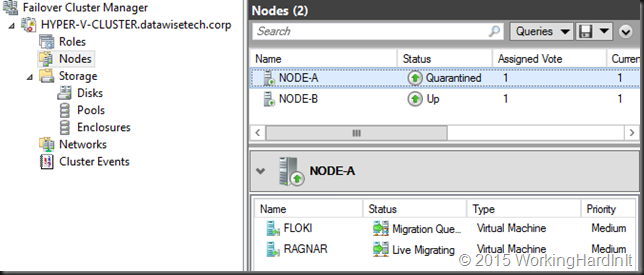
  • If a node, does recover but goes into isolated 3 times within 1 hour, it is placed into a Quarantine state for the time specified in QuarantineDuration (default two hours or 7200 s) . The VMS running on this node are drained to another node in the cluster. So if you crash that service repeatedly (3 times within an hour) the Hyper-V Node will go into  “Quarantine” status for the time specified (in our lab 5 minutes as we set it to 300 s). The VMs will be live migrated off even if the node is up and running when the cluster service comes up again.

You might notice that this screenshot is a different lab cluster. Yes, it’s a TPv1 cluster as for some reason the Live Migration part on Quarantine is broken on my TPv2 lab. It’s a clean install, completely green field. Probably a bug.image

It’s the frequency of failures that determines that the node goes into quarantine for the amount of time specified. That’s a clear sign for you to investigate and make sure things are OK. The node is no longer allowed to join the cluster for a fixed time period (default: 2 hours)­. The reason for this is to prevent “flapping nodes” from negatively impacting other nodes and the overall cluster health. There is also a fixed (not configurable as far as I know) amount if nodes that can be quarantined at any give time: 20% or only one node can be quarantined (whatever comes first, in the case of a 2, 3 or for node cluster it’s one node max that can be in quarantine).

If you want to get a quarantined node out of quarantine immediately you can rejoin it to the cluster via a single PowerShell command: Start-ClusterNode –CQ  (CQ = Clear Quarantine). Handy in the lab or in real live when things have been fixed and you want that node back in action asap.

Conclusion

Now this sounds pretty good doesn’t it? And it is. Especially if you’re running you’re running your VMs on a SOFS share. Then the VMs will remain online during the Isolation / Unmonitored phase but when you have “traditional” block level storage they won’t. They’ll go in mode as the in that design you have lost access to the CSV. Now, if you ever needed yet another reason to move to a Scale Out File Server & SMB 3 to deliver storage for your VMs I have just given you one! Hey storage vendors … how is that full SMB 3 feature stack coming on your storage arrays? Or do you really just want us to abstract you away behind a Windows SOFS cluster?

Subhasish Bhattacharya Has blogged about this as well here. It’s a feature we’ll test at length to get a grip on the behavior so we know how the cluster nodes will behave under certain conditions. Trust, but verify is my mantra and it’s way better to figure out how a feature behaves in the lab than having to figure it out when you see it for the very first time in production based on assumptions. Just saying.

Dell Storage Replay Manager 7.6.0.47 for Compellent 6.5

Recently as a DELL Compellent customer version 7.6.0.47 became available to us. I download it and found some welcome new capabilities in the release notes.

  • Support for vSphere 6
  • 2024 bit public key support for SSL/TLS
  • The ability to retry failed jobs (Microsoft Extensions Only)
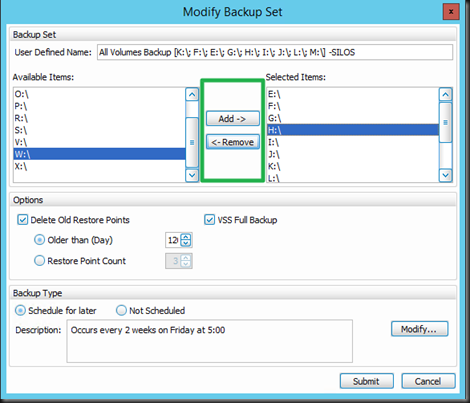
  • The ability to modify a backup set (Microsoft Extensions Only)

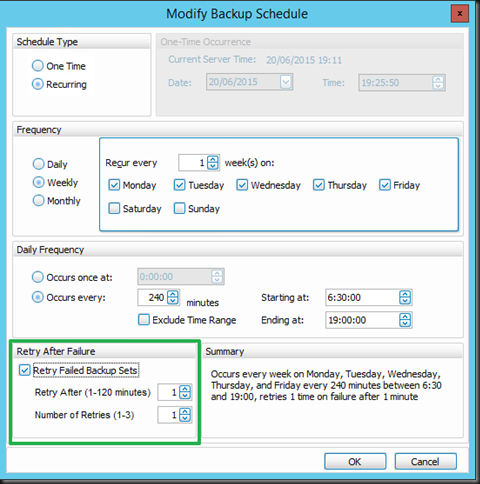
The ability to retry failed jobs is handy. There might be a conflicting backup running via a 3rd party tool leveraging the hardware VSS provider. So the ability to retry can mitigate this. As we do multiple replays per day and have them scheduled recurrently we already mitigated the negative effects of this, but this only gibes us more options to deal with such situations. It’s good.

image

The ability to modify a backup set is one I love. It was just so annoying not to be able to do this before. A change in the environment meant having to create a new backup set. That also meant keeping around the old job for as long as you wanted to retain the replays associated with that job. Not the most optimal way of handling change I’d say, so this made me happy when I saw it.

image

Now I’d like DELL to invest a bit more in make restore of volume based replays of virtual machines easier. I actually like the volume based ones with Hyper-V as it’s one snapshot per CSV for all VMs and it doesn’t require all the VMs to reside on the host where we originally defined the backup set. Optimally you do run all the VMs on the node that own the CSV but otherwise it has less restrictions. I my humble opinion anything that restricts VM mobility is bad and goes against the grain of virtualization and dynamic optimization. I wonder if this has more to do with older CVS/Hyper-V versions, current limitations in Windows Server Hyper-V or CVS or a combination. This makes for a nice discussion, so if anyone from MSFT & the DELL Storage team responsible for Repay Manager wants to have one, just let me know Smile 

Last but not least I’d love DELL to communicate in Q4 of 2015 on how they will integrate their data protection offering in Compellent/Replay manager with Windows Server 2016 Backup changes and enhancements. That’s quite a change that’s happing for Hyper-V and it would be good for all to know what’s being done to leverage that. Another thing that is high on my priority for success is to enable leveraging replays with Live Volumes. For me that’s the biggest drawback to Live Volumes: having to chose between high/continuous availability and application consistent replays for data protection and other use cases).

I have some more things on my wish list but these are out of scope in regards to the subject of this blog post.

Updating Hyper-V Integration Services: An error has occurred: One of the update processes returned error code 1603

So you migrate over 200 VMs from a previous version of Hyper-V to Windows Server 2012 R2 fully patched and life looks great, full of possibilities etc. However one thing get’s back to your e-mail inbox consistently: a couple of Windows Server 2003 R2 SP2 (x64) and Windows XP SP3 (x86) virtual machines. The VEEAM backups consistently fail. Digging into that the cause is pretty obvious … it tells you where to problem lies.

image

Ah they forgot the upgrade the IS components you might conclude. Let’s see if we try an upgrade. Yes they are offered and you run them … looks to be going well too. But then you’re greeted by "An error has occurred: One of the update processes returned error code 1603”.

Darn! Now you can go and do all kinds of stuff to find out what part of the integrations services are messed up as most day to day operations work fine (registry, explore, versions, security settings …) or be smart a leverage the power of PowerShell. It’s easy to find out what is not right via a simple commandlet  Get-VMIntegrationService

image

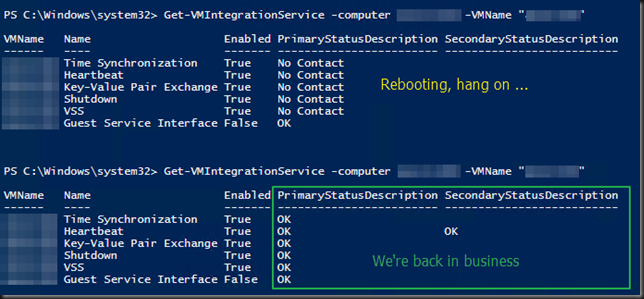
We’ll that’s obvious. So how to fix this. I uninstalled the IS components, rebooted the VM, reinstalled the IS components  … which requires another reboot. While the VM is rebooting you can take a peak at the integration services status with Get-VMIntegrationService

image

That’s it, all is well again and backups run just fine. Lessons learned here are that SCOM was completely happy with the bad situation … that isn’t good Smile.

So there’s the solution for you but it’s kind of “omen” like that it happened to three Windows 2003 virtual machines (both x64 and x86). You really need to get off these obsolete operating systems. Staying will never improve things but I guarantee you they will get worse.

See you at a next blog Winking smile