The first time we used the Storage QoS capabilities in Windows Server 2012 R2 it was done in a trial and error fashion. We knew that it was the new VM causing the disruption and kind of dropped the Maximum IOPS to a level that was acceptable. We also ran some PerfMon stats & looked at the IOPS on the HBA going the host. It was all a bit tedious and convoluted. Discussing this with Senthil Rajaram, who’s heavily involved with anything storage at Microsoft he educated me on how to get it done fast & easy.
Fast & easy insight into virtual machine IOPS.
The fast and easy way to get a quick feel for what IOPS a VM is generating has become available via resource metering and Measure-VM. In Windows Server 2012 R2 we have new storage metrics we can use for that, it’s not just cool for charge back or show back ![]() .
.
So what did we get extra in Windows Server 2012 R2? Well, some new storage metrics per virtual disk
- Average Normalized IOPS (Averaged over 20s)
- Average latency (Averaged over 20s)
- Aggregate Data Written (between start and stop metric command)
- Aggregate Data Read (between start and stop metric command)
Well that sounds exactly like what we need!
How to use this when you want to do storage QoS on a virtual machine’s virtual disk or disks
All we need to do is turn on resource metering for the VMs of interest. The below command run in an elevated PowerShell console will enable it for all VMs on a host.
We now run measure-VM DidierTest01 | fl and see that we have no values yet for the properties . Since we haven’t generated any IOPS yes this is normal.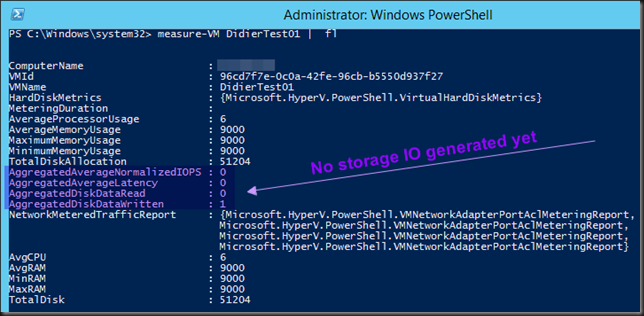
So we now run IOMeter to generate some IOPS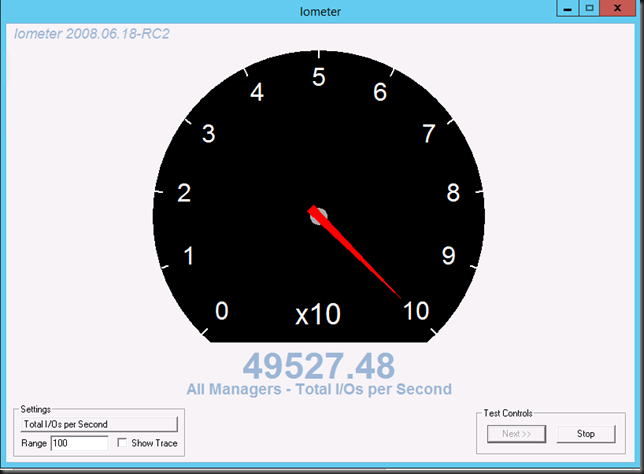
and than run measure-VM DidierTest01 | fl again. We see that the properties have risen.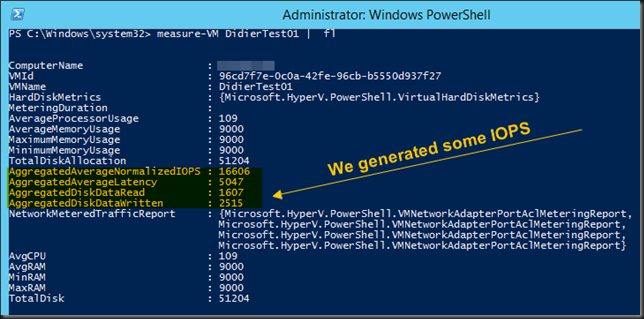
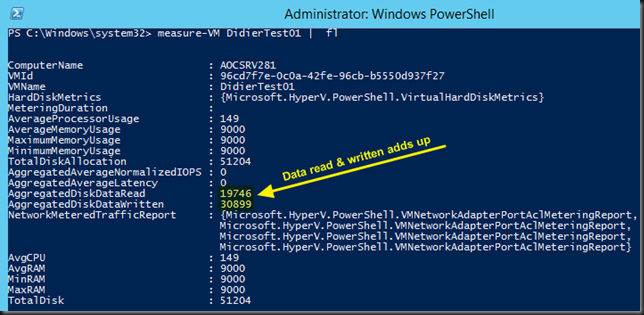
It’s normal that the AggregatedAverageNormalizedIOPS and AggregatedAverageLatency are the averages measured over a period of 20 seconds at the moment of sampling. The value AggregatedDiskDataRead and AggregatedDiskDataWritten are the averages since we started counting (since we ran Enable-VMResourceMetering for that VM ), it’s a running sum, so it’s normal that the average is lower initially than we expected as the VM was idle between enabling resource metering and generating some IOPS.
All we need to do is keep the VM idle wait 30 seconds so and when we run again measure-VM DidierTest01 | fl again we see the following?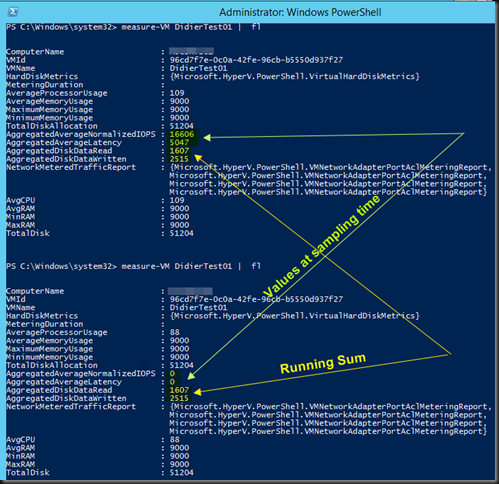
While the values AggregatedAverageNormalizedIOPS and AggregatedAverageLatency are the value reflecting a 20s average that’s collected at measuring time and as such drop to zero over time. The values for AggregatedDiskDataRead and AggregatedDiskDataWritten are a running sum. They stay the same until we disable or reset resource metering.
Let’s generate some extra IO, after which we wait a while (> 20 seconds) before we run measure-VM DidierTest01 | fl again and get updated information. We confirm see that indeed AggregatedDiskDataRead and AggregatedDiskDataWritten is a running sum and that AggregatedAverageNormalizedIOPS and AggregatedAverageLatency have dropped to 0 again.
Anyway, it’s clear to you that the sampled value of AggregatedAverageNormalizedIOPS is what you’re interested in when trying to get a feel for the value you need to set in order to limit a virtual hard disk to an acceptable number of normalized IOPS.
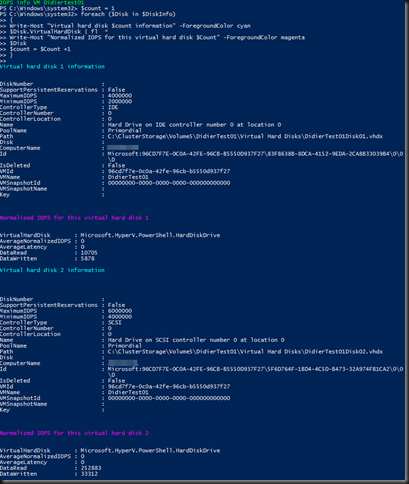
But wait, that’s aggregated! I have SQL Server VMs with 4 virtual hard disks. How do I know what hard disk is generating what IOPS? The docs say the metrics are per virtual hard disk, right?! I need to know if it’s the virtual hard disk with TempDB or the one with the LOGS causing the IO issue.
Well the info is there but it requires a few more lines of PowerShell:
cls
$VMName  = "Didiertest01"
enable-VMresourcemetering -VMName $VMName
$VMReport = measure-VM $VMName
$DiskInfo = $VMReport.HardDiskMetrics
write-Host "IOPS info VM $VMName" -ForegroundColor Green
$count = 1
foreach ($Disk in $DiskInfo)
{
Write-Host "Virtual hard disk $count information" -ForegroundColor cyan
$Disk.VirtualHardDisk | fl  *
Write-Host "Normalized IOPS for this virtual hard disk" -ForegroundColor cyan
$Disk
$count = $Count +1
}
Resulting in following output:
Hope this helps! Windows Server 2012 R2 make life as a virtualization admin easier with nice tools like this at our disposal.

