The first time we used the Storage QoS capabilities in Windows Server 2012 R2 it was done in a trial and error fashion. We knew that it was the new VM causing the disruption and kind of dropped the Maximum IOPS to a level that was acceptable. We also ran some PerfMon stats & looked at the IOPS on the HBA going the host. It was all a bit tedious and convoluted. Discussing this with Senthil Rajaram, who’s heavily involved with anything storage at Microsoft he educated me on how to get it done fast & easy.
Fast & easy insight into virtual machine IOPS.
The fast and easy way to get a quick feel for what IOPS a VM is generating has become available via resource metering and Measure-VM. In Windows Server 2012 R2 we have new storage metrics we can use for that, it’s not just cool for charge back or show back ![]() .
.
So what did we get extra in Windows Server 2012 R2? Well, some new storage metrics per virtual disk
- Average Normalized IOPS (Averaged over 20s)
- Average latency (Averaged over 20s)
- Aggregate Data Written (between start and stop metric command)
- Aggregate Data Read (between start and stop metric command)
Well that sounds exactly like what we need!
How to use this when you want to do storage QoS on a virtual machine’s virtual disk or disks
All we need to do is turn on resource metering for the VMs of interest. The below command run in an elevated PowerShell console will enable it for all VMs on a host.
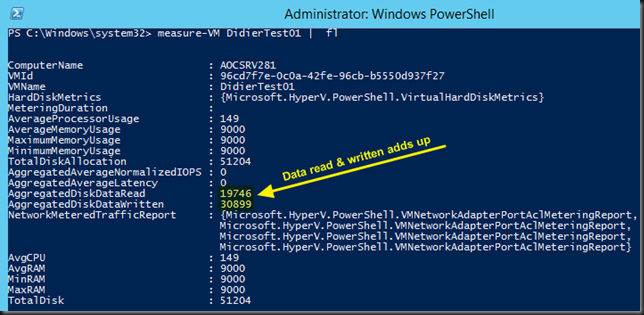
We now run measure-VM DidierTest01 | fl and see that we have no values yet for the properties . Since we haven’t generated any IOPS yes this is normal.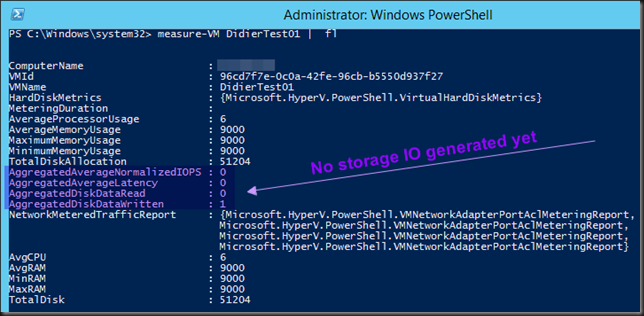
So we now run IOMeter to generate some IOPS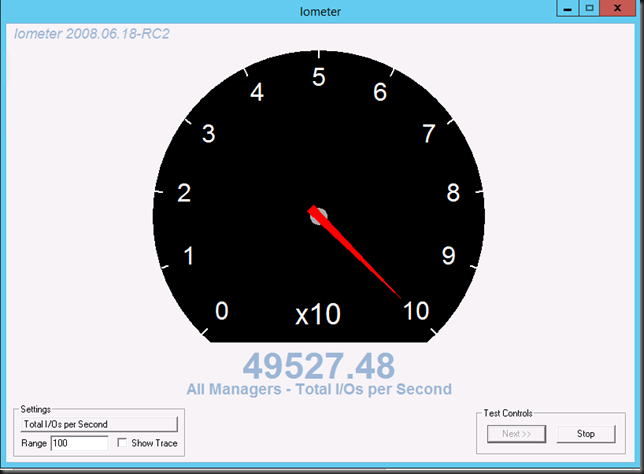
and than run measure-VM DidierTest01 | fl again. We see that the properties have risen.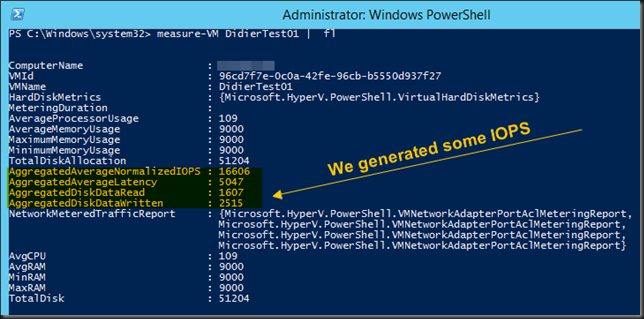
It’s normal that the AggregatedAverageNormalizedIOPS and AggregatedAverageLatency are the averages measured over a period of 20 seconds at the moment of sampling. The value AggregatedDiskDataRead and AggregatedDiskDataWritten are the averages since we started counting (since we ran Enable-VMResourceMetering for that VM ), it’s a running sum, so it’s normal that the average is lower initially than we expected as the VM was idle between enabling resource metering and generating some IOPS.
All we need to do is keep the VM idle wait 30 seconds so and when we run again measure-VM DidierTest01 | fl again we see the following?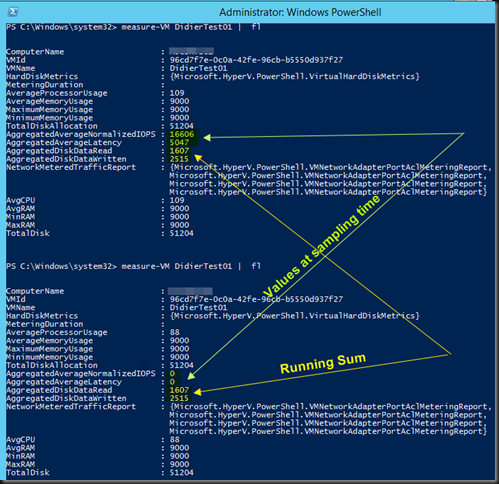
While the values AggregatedAverageNormalizedIOPS and AggregatedAverageLatency are the value reflecting a 20s average that’s collected at measuring time and as such drop to zero over time. The values for AggregatedDiskDataRead and AggregatedDiskDataWritten are a running sum. They stay the same until we disable or reset resource metering.
Let’s generate some extra IO, after which we wait a while (> 20 seconds) before we run measure-VM DidierTest01 | fl again and get updated information. We confirm see that indeed AggregatedDiskDataRead and AggregatedDiskDataWritten is a running sum and that AggregatedAverageNormalizedIOPS and AggregatedAverageLatency have dropped to 0 again.
Anyway, it’s clear to you that the sampled value of AggregatedAverageNormalizedIOPS is what you’re interested in when trying to get a feel for the value you need to set in order to limit a virtual hard disk to an acceptable number of normalized IOPS.
But wait, that’s aggregated! I have SQL Server VMs with 4 virtual hard disks. How do I know what hard disk is generating what IOPS? The docs say the metrics are per virtual hard disk, right?! I need to know if it’s the virtual hard disk with TempDB or the one with the LOGS causing the IO issue.
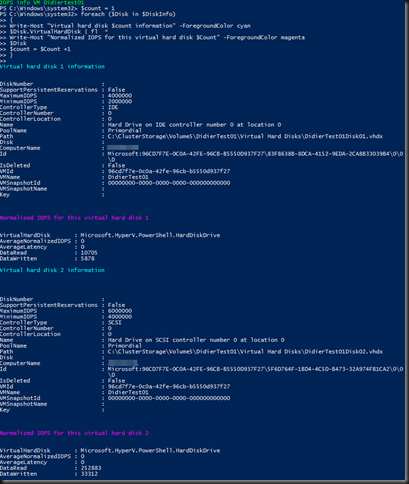
Well the info is there but it requires a few more lines of PowerShell:
cls
$VMName  = "Didiertest01"
enable-VMresourcemetering -VMName $VMName
$VMReport = measure-VM $VMName
$DiskInfo = $VMReport.HardDiskMetrics
write-Host "IOPS info VM $VMName" -ForegroundColor Green
$count = 1
foreach ($Disk in $DiskInfo)
{
Write-Host "Virtual hard disk $count information" -ForegroundColor cyan
$Disk.VirtualHardDisk | fl  *
Write-Host "Normalized IOPS for this virtual hard disk" -ForegroundColor cyan
$Disk
$count = $Count +1
}
Resulting in following output:
Hope this helps! Windows Server 2012 R2 make life as a virtualization admin easier with nice tools like this at our disposal.

Excellent, thank you!
Thank you, glad it helps!
Pingback: Microsoft Most Valuable Professional (MVP) – Best Posts of the Week around Windows Server, Exchange, SystemCenter and more – #63 - Dell TechCenter - TechCenter - Dell Community
Did you also do this on a clustered VM? I get an error when I Try to enable metering on a CSV basedVM, on a standalone Hyper-V hosts it all works brilliantly..
All you read here is with on VMs running on W2K12R2 HYPER-V clusters, not on a stand alone HYPER-V server. I did not yet test it on cluster VMs, i.e, guest clustering with shared VHDX.
This is fantastic, thank you very much.
A bit unrelated to storage QoS, have you ever noticed on your Hyper-V hosts that resource metering for a VM simply stalls? It reports that it is enabled, but all meters are empty. The only workaround is to disable & enable resource metering for that VM. It happens to random virtual machines. No trace of any kind of errors in logs. It’s been driving me nuts and I have no idea who can help me with this…
Great !
But how can I evaluate the number of disk to size my SAN ?
For instance this day between 08h and 12h, I have on an oracle VM with 6 virtual disk (.vhdx) in a RAID 50 with 24 disks : AggregatedDiskDataRead=35075, AggregatedDiskDataWritten=24329, so TotalIO=59404 and TotalIOPS=4.125 (totalIO/(3600*4)). AggregatedAverageNormalizedIOPS is 1332 at 09h, 619 at 10h, 642 at 11h, 332 at 12h. What is the good IOPS to size my SAN : 4,12 or 1332 or 600 or 300 ?
Furthermore, You say “The docs say the metrics are per virtual hard disk”, what does it means : I have 4.12 IOPS on 6 vhdx or 4.12 IOPS by vhdx so a total of 4.12*6 IOPS for this VM ?
Each physical disk in the SAN is SAS 10K, so with 130 IOPS, how many disks is necessary with RAID10 (disk penalty=2) or RAID50 (disk penalty=4) ? Here the VM runs on 24 SAS 10K with RAID50 but it’s very very slow when it runs on 4 SAS 10K RAID10.
It’s strange because, on an other side, with perfmon on this VM, I have “Logical disk / Disk Reads/sec _Total”=100, “Disk Writes/sec _Total”=200 and “Disk Transfers/sec _Total”=300, so IOPS is 300 finally (and not 4.12) ?
I find a formula on http://theithollow.com/2012/03/understanding-raid-penalty/ and with this I have
24 disk RAID5 => Raw IOPS = 130*24 = 3120 and Functional IOPS = (3120*0.4/4)+(3120*0.6)=2184
4 disk RAID10 => Raw IOPS = 130*4 = 520 and Functional IOPS = (520*0.4/2)+(520*0.6)=416
So the 2 disk configuration seems to be OK for IOPS used by this VM ?
Thanks a lot
Great post.
Pingback: Hyper-V Storage QoS in Windows Server 2016 Works on SOFS and on LUNs/CSVs - Working Hard In IT
Its good post, but I don’t understand what’s AggregatedAverageLatency means? If i have a VM with 1000 AggregatedAverageLatency it’s high? Where i can find a doc about thhis?
Tks
That’s not high at all. Is the aggregated latency over a period of 20 seconds. A VM at rest doing just about nothing nothing will show that easily.
Could you please provide information what units AggregatedAverageLatency uses to generate result?
it’s the average over a 20 second period of measurements (Normalized IOPS) in µs.