Introduction
In Windows Server 2016 we have a new option when it comes to creating memory dumps when a system failure occurs. The new option – “Active Memory Dump” – to configure a memory dump is not strictly related to failover clustering or Hyper-V. But this is the poster child environment where this setting will make a significant impact when collecting MEMORY.DMP files trouble shooting.
Hyper-V clusters tend to exist out of multiple hosts with high amounts of RAM. 256GB to 1TB of RAM is not an exception anymore. This has two reasons. In general, virtual machine density increases as the servers become ever more capable and affordable. The second reason is that ever more high performance workloads that are resource intensive are being virtualized.
The N+X nature of clusters means that even more RAM is provisioned as we need to allow for the hosts to serve extra virtual machines during scheduled or unscheduled maintenance.
To trouble shoot issues with a Hyper-V host support engineers often request a complete memory dump. This contains the processor state and the content of what’s in memory at the time of the crash. The size of these memory dumps becomes problematically large on hosts with large amounts of memory. You run out of space to create them (who has 512GB or more free space to write that dump to?) and it is problematic and time consuming to copy such files and upload them for analysis.
Active Memory Dump
So how does active memory dump address these concerns? For trouble shooting issues with the Hyper-V hosts we usually do not need the part of the RAM that is assigned to the virtual machines. On large memory Hyper-V host the majority of the RAM goes to virtual machines. An active memory dump filters out that part of the RAM content. By doing so that memory dump contains the processors state and the memory content related to the parent partition, including the user mode space, which are truly relevant to troubleshooting Blue Screen of Death events. While it’s not the smallest of possible memory dump options it is significantly smaller than a complete memory dump.
How do I configure it?
There’s two ways to do this. Via the GUI or PowerShell. Both result in exactly the same changes and configuration but the PowerShell method gives us a better insight in how an active memory dump is created.
GUI
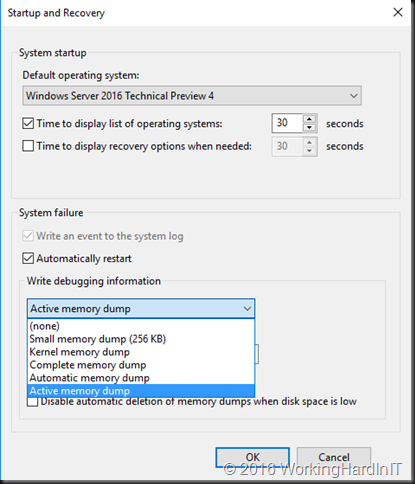
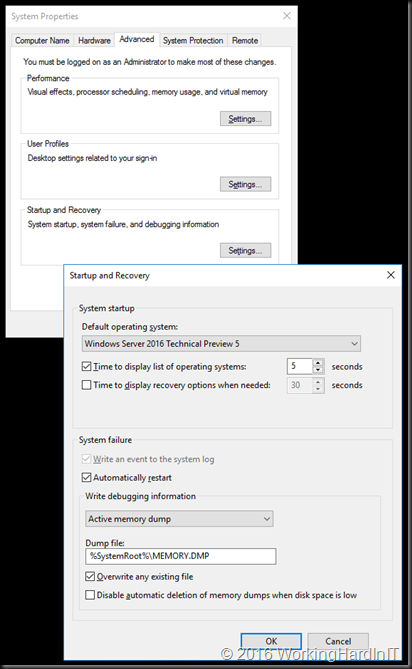
On the Advanced tab of system properties, you select the setting for “Startup and Recovery”. That’s where you can set the memory dump option under Write debugging information.
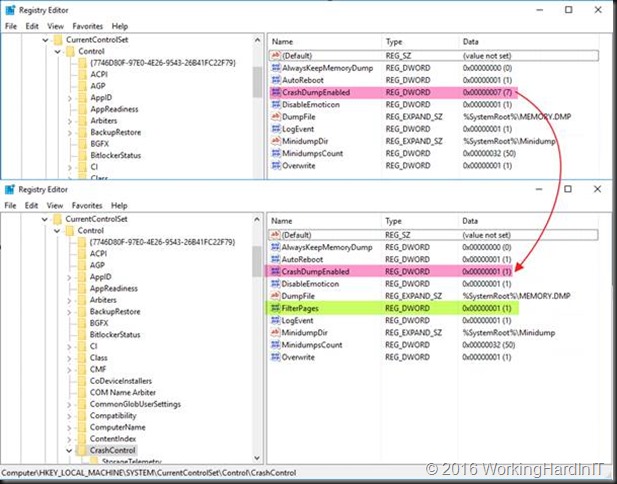
This is reflected in two registry setting under the HKLM:\System\CurrentControlSet\Control\CrashControl key
The REG_DWORD value CrashDumpEnabled is set to 1 (default is 7) which translates into a complete memory dump.
The REG_DWORD value FilterPages is created and is set to 1
This translates in what we explained above.
An active memory dump is a complete memory dump (CrashDumpEnabed value =1) that is filtered ( FilterPages value = 1). Note that when you choose another option in the GUI the FilterPages value is not set to 0 but is actually removed.
PowerShell
Using PowerShell this is achieved as follows.
Keep in mind that the FilterPages value doesn’t exist if you haven’t configured Active memory dump s trying to read it will throw an error.
If you want to mimic the GUI exactly via PowerShell you’ll need to remove the value instead of setting it to 0.
PoSh code
#Take a look at the settings
Get-ItemProperty –Path HKLM:\System\CurrentControlSet\Control\CrashControl –Name CrashDumpEnabled
Get-ItemProperty –Path HKLM:\System\CurrentControlSet\Control\CrashControl –Name FilterPages
#Configure Active memory dump
Set-ItemProperty –Path HKLM:\System\CurrentControlSet\Control\CrashControl –Name CrashDumpEnabled –value 1
Set-ItemProperty –Path HKLM:\System\CurrentControlSet\Control\CrashControl –Name FilterPages –value 1
#Set it back to Automatic memory dump (default)
Set-ItemProperty –Path HKLM:\System\CurrentControlSet\Control\CrashControl –Name CrashDumpEnabled –value 7
Remove-ItemProperty –Path HKLM:\System\CurrentControlSet\Control\CrashControl –Name FilterPages –value 1
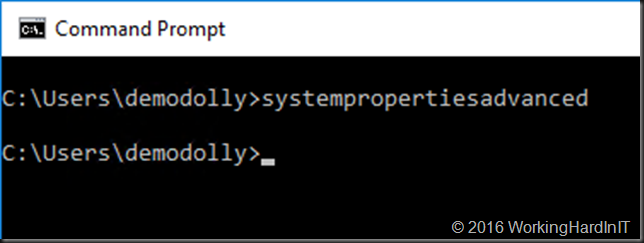
NOTE: When you edit the registry to change this setting a reboot is required to active them. So the GUI might be your preferred way of doing things here. For the people using Windows Server Core there is a command “systempropertiesadvanced” you can run from your command prompt to get to the advanced tab of System properties. From there you get to the Startup and Recovery settings. Also note that some changes between these setting will always require a restart.
Results
To get an idea what this means on a large memory Hyper-V host I did some testing on an enterprise grade server in a simulated setup so in real life the Active dump might very well be a bit larger than here but still the ratios tell the story.
Active memory dump: 7,60 GB
Kernel memory dump: 6,62 GB
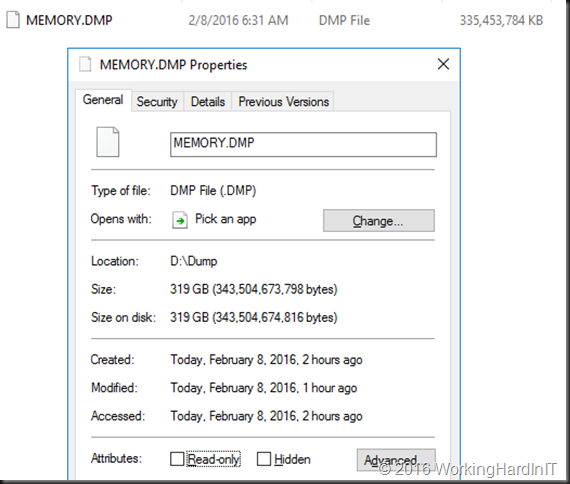
Complete Memory dump: 319 GB
No what you need to realize that to create that Active memory dump you don’t need to create a page file the size of your physical memory. That a big deal! In many situations you’ll be hitting the problem of insufficient disk space for the page file and the memory dump to achieve this.
The active memory dump option gives us (or the support engineers) all the most relevant information they need without the overhead and practical problems associated with a complete memory dump. It kind of has my vote to become the new default option.



Looks like with RTM 2016 systempropertiesadvanced says not recognized as command.
Indeed. Not present in RS1.
Hi,
How I can read the MEMORY.DMP file in Windows Server 2016?.
Best regards,
Windbg, etc. Google for info on how to use it.